This is an introduction to a package that is useful for expressing multivariable relationships. For basic use, the contents of the exsample command should be sufficient. For other options, see the package help.
This package is recommended because the plot contents can be easily changed at the top and bottom.
In addition, packages that use the ggplot2 package are also presented for your reference. Why not use them according to your preferences?
・Analysis in R: Useful for understanding multivariable relationships! The “ggcorrplot” package
https://www.karada-good.net/analyticsr/r-381/
Package version is 0.9.2. Checked with R version 4.2.2.
Install Package
Run the following command.
#Install Package
install.packages("corrplot")
Example
See the command and package help for details.
#Loading the library
library("corrplot")
#Correlation coefficient calculation: stat package; cor command
#Use "mtcars" from darasets package for data
CorResult <- cor(mtcars, method = "pearson")
#Plotting results: corrplot command
#Specify plot contents:method option;"circle","square","ellipse",
#"number","shade","color","pie"
#Specify plot position: type option;full,lower,upper
#Symbol color:col option
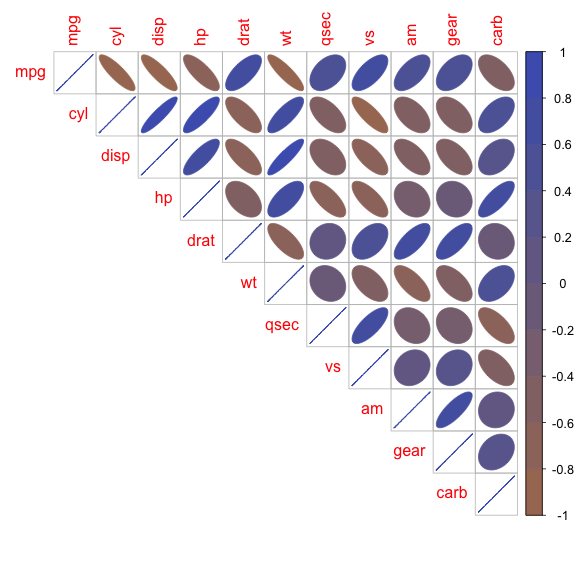
corrplot(corr = CorResult, method = "ellipse", type = "upper",
col = colorRampPalette(c("#a87963", "#4b61ba"))(10))
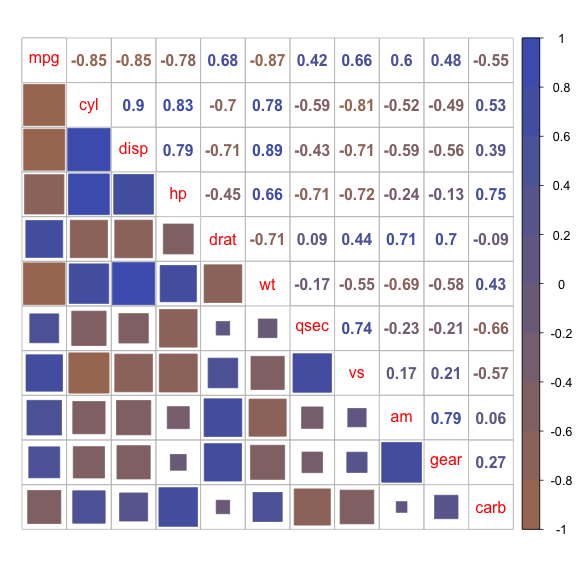
#Plotting with different plot contents at top and bottom: corrplot.mixed command
#Specify the contents of the lower plot: lower;
#the specified contents are common to the corrplot command
#Specify the contents of the upper plot: lower;
#the specified contents are common to the corrplot command
#Symbol color:col option
corrplot.mixed(corr = CorResult, lower = "square", upper = "number",
lower.col = colorRampPalette(c("#a87963", "#4b61ba"))(10),
upper.col = colorRampPalette(c("#a87963", "#4b61ba"))(10))Output Example
・corrplot command
・corrplot.mixed command
I hope this makes your analysis a little easier !!