This is an introduction to the commands of the “openxlsx” package, which is very useful for creating Excel files. The package allows you to create a “workbook object” with the “createWorkbook” command, add data, arrange the appearance of cells with conditional formatting and borders, and add output such as the “ggplot2” package to create an Excel file.
Package version is 4.2.5.1. R version 4.2.2 is confirmed.
<おすすめのRに関する書籍です>

Installing packages
Run the following command.
#Installing packages
install.packages("openxlsx")
Before the execution command
Execute the following command to load various packages.
#Run the openxlsx package
library("openxlsx")

#Install the tidyverse package if it is not already installed
#Used to create graphs with the ggplot2 package
if(!require("tidyverse", quietly = TRUE)){
  install.packages("tidyverse");require("tidyverse")
}
Execute command
See the command and package help for details.
Reading xlsx files: “read.xlsx” command
#Reading xlsx files: read.xlsx command
#Select xlsx file
XLPath <- paste0(as.character(
  tkgetOpenFile(title = "Select xlsx file",
                filetypes = '{"xlsx file" {".xlsx"}}',
                initialfile = c("*.xlsx"))), collapse = " ")

#Read xlsx file:read.xlsx command
#Specify the xlsx file to read:xlsxFile option
#Specify the sheet to read:sheet option
#Specify the row to start reading:startRow Option
#Set column names: colNames option; TRUE: the first row is the column name / FALSE: none
#Set row names: rowNames option; TRUE: first column is row name / FALSE: none
#Detect dates and set conversion: detectDates option;TRUE/FALSE
#Process empty columns up to data: skipEmptyCols option;TRUE:skip empty rows/FALSE:empty NA
#Process empty rows up to data: skipEmptyRows option;TRUE:skip empty rows/FALSE:NA empty
#Row range to read data from: rows option; NULL to specify all, single/c(5, 7),c(2:12), etc.
#columns option; NULL to specify all, single/c(5,7), c(2:12), etc.
#Check column names for duplicates: check.names option;TRUE: assign [.No] if duplicates are found/FALSE
#Insert column names in spaces:sep.names option
#Get the specified named region:namedRegion option;NULL/set "region name
#Set characters to be recognized as NA values: na.strings option
#Process for merged cells: fillMergedCells option; TRUE: same value for merged cell range
read.xlsx(xlsxFile = XLPath, sheet = 1,
          startRow = 1, colNames = TRUE,
          rowNames = FALSE, detectDates = FALSE,
          skipEmptyCols = FALSE, #skipEmptyRows = TRUE,
          rows = NULL, cols = NULL,
          check.names = FALSE, sep.names = ".",
          namedRegion = NULL, na.strings = "TEST",
          fillMergedCells = FALSE)
Save xlsx file: “write.xlsx” command
#Specify data: x option; multiple data can be stored in list class and saved at once
#Specify filename:file option; if no file path, save to working folder
#Overwrite settings: overwrite option; TRUE/FALSE
###Cell styles can be created and specified separately with the createStyle command#####
###Other parameter options are also introduced#####
###[Save with style] #####
write.xlsx(x = list("Iris" = iris, "Cars" = cars),
           file = "Test.xlsx",
           overwrite = TRUE)
Create cell style: “createStyle” command
The “addStyle” command used in conjunction with the “createWorkbook” command, as well as the “write.xlsx” command and the “conditionalFormatting” command, creates the “Style Object” needed to set the cell appearance command. The latter allows for more fine-tuning.
#Font:fontName option; initial value: "Calibri
#Font size:fontSize option; initial value: "11
#Font color:fontColour option; initial value: "black
##Cell format:numFmt option; "GENERAL", "NUMBER", "CURRENCY",
##"ACCOUNTING", "DATA", "LONGDATE", "TIME", "PERCENTAGE", "FRACTION", "SCIENTIFIC",
##"TEXT", "COMMA", user-defined 'month day','0.00', etc. possible
##Border position: border options; "NULL", "top", "bottom", "left", "right", "TopBottom",
##"LeftRight", "TopLeftRight", "TopBottomLeftRight" are available
##Color of the border: borderColour option; must be applied with a border option other than "NULL".
#Border style: BorderStyle option; must be set with a border option other than "NULL",
##"none", "thin", "medium", "dashed", "dotted", "thick", "double", "hair", "mediumDashed",
##"dashDot", "mediumDashDot", "mediumDashDotDot", "slantDashDot" are available
#Conditional cell fill color:bgFill option; only applies to conditional formatting
#CellFillColor:fgFill option; set normal background color
#Horizontal text position:align option; Default value: NULL, "left", "right", "center", and "justify" are available.
#Character vertical position: valign option; default: NULL, "top", "center", and "buttom" are allowed
##Font style:textDecoration option; initial value:NULL, "bold", "strikout", "italic",
Allow ##"underline", "underline2", "accounting", "accounting2
##Wrap text to show the whole text:wrapText option;TRUE/FALSE
#Direction of text: textRotation option; default:NULL,0:255
#Character indentation:indent option; initial value:NULL
#Locking of protection: locked option; initial value:NULL,TRUE/FALSE
#Display protection setting:hidden option:NULL,TRUE/FALSE
CellStyle <- createStyle(fontName = "Arial",
                         fontSize = 12,
                         fontColour = "black",
                         numFmt = 'm"月"d"日"',
                         border = "top",
                         borderColour = "black",
                         borderStyle = "none",
                         bgFill = NULL,
                         fgFill = "green",
                         halign = "center",
                         valign = NULL,
                         textDecoration = "accounting2",
                         wrapText = FALSE,
                         textRotation = 0,
                         indent = 1,
                         locked = TRUE,
                         hidden = FALSE)
Saving in a neat format: “write.xlsx” command
#Replaced by NA
iris[1, 2:3] <- NA
#Save
write.xlsx(x = list("Iris" = iris, "Cars" = cars),
           file = "Test.xlsx",
           overwrite = TRUE,
           #Set sheet name: sheetName option
           sheetName = c("Iris", "Cars"),
           #Display settings for grid lines: gridLines option; TRUE/FALSE: show/hide
           gridLines = c(FALSE,TRUE),
           #Set tab color: tabColour option
           tabColour = c("red", "green"),
           #Sheet Magnification Settings: zoom option; 10:400 range
           zoom = c(80, 120),
           #Set write start column:startCol option;c(sheet1, sheet2, ...)
           startCol = c(3, 5),
           #Set write start row:startRow option;c(sheet1, sheet2, ...)
           startRow = 2,
           #Batch setting to start writing column rows:xy option;c(startCol, startRow)
           #xy = c("A2", "c1"),
           #Assigning column names;colnames option:TRUE/FALSE
           colNames = TRUE,
           #Assigning row names:rowNames option:TRUE/FALSE
           rowNames = FALSE,
           #Customize the columns name style:headerStyle option
           #Specify the Style object created by the createStyle command
           headerStyle = CellStyle,
           #Draw a line around the data:borders option;
           #NULL,"surrounding","columns","rows"
           borders = "surrounding",
           #borders colour:borderColour
           borderColour = "red",
           #border style:borderStyle optin,
           #Similar to the borderStyle option of the createStyle command
           borderStyle = "medium",
           #Save NA as #N/A instead of blank;TRUE/FALSE
           keepNA = TRUE,
           #Window frame row fixing:firstActiveRow option
           firstActiveRow = 3,
           #Window frame column fixation:firstActiveCol option
           firstActiveCol = 4,
           #Specify column width:colWidths option;"auto"/numeric
           #colWidths = c("auto", "auto"),
           #Set filter:withFilter option;TRUE/FALSE
           withFilter = c(TRUE, FALSE)
           )
“Workbook object” to be fine-tuned
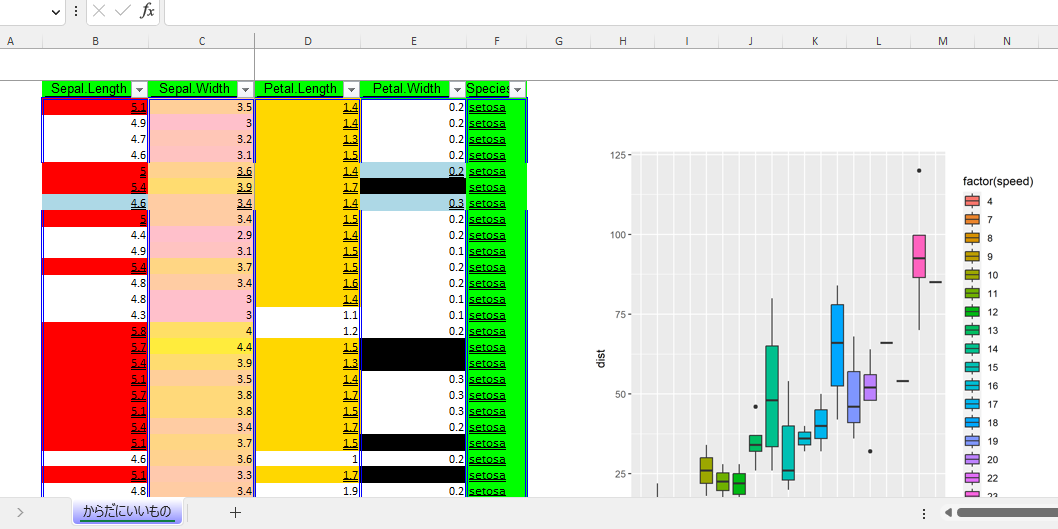
The createWorkbook command creates a “Workbook object”, writes data, and creates an Excel file with various styles. The run command also shows an example of adding the output of the ggplot2 package to a sheet.
The sample Excel output can be created by running it in order from the top.
#Create a Workbook object: createWorkbook command
#Set creator: creator option; default: login user name
#Set title property: title option; initial value: NULL
#Set subject property: subject option; initial value: NULL
#Category property settings:category option; initial value:NULL
TestWb <- createWorkbook(creator = "KARADA GOOD",
                         title = "KARADA",
                         subject = "GOOD",
                         category = "R TEST")

#Add a worksheet: addWorksheet command
#Specify a workbook object: wb option
#Create a sheet name: sheetName option
#Show grid lines: gridLines option; TRUE/FALSE
#Tab color: tabColour option; default:NULL
#Zoom settings: zoom option; 10:400 range
### Shortcodes available for the following headers and footers ###
#&[Page]:Page number,&[Pages]:Number of pages,
#&[Date]:Current date,&[Time]:Current time,
#&[Path]:File path,&[File]:File name,
#&&[Tab]:Sheet name
#header settings:header option;c(left,center,right)
#Footer settings:footer option;c(left,center,right)
#Even page header settings:evenHeader option;c(left,center,right)
#Even page footer settings:evenFooter option;c(left side,center,right side)
#First page header settings:firstHeader option;c(left,center,right)
#First Page Footer Settings:firstFooter option;c(left side,center,right side)
#visible setting:visible option;TRUE/FALSE: FALSE is not allowed if there is only one sheet.
#PaperSize:paperSize option;8:A3,9:A4,11:A5,12:B4,13:B5,
#67:A3 width, 55:A4 width, 61:A5 width, other sizes can be checked in pageSetup.
#Option: Orientation option; "portrait"/"landscape".
addWorksheet(wb = TestWb,
             sheetName = "KARADA GOOD",
             gridLines = FALSE,
             tabColour = "blue",
             zoom = 80,
             header = c("からだに", "いいもの", "R情報"),
             footer = c("KARADA", "GOOD", "R INFO &[Page],&[Pages]"),
             evenHeader = c("偶数からだに&[Date],&[Time],", "偶数いいもの", NA),
             evenFooter = c("EVEN KARADA", "EVEN GOOD", "EVEN R INFO"),
             firstHeader = c("先頭からだに", "&[Path],&[File],&[Tab]",
                             "先頭R情報"),
             firstFooter = c("First KARADA", NA, "First R INFO"),
             visible = TRUE,
             paperSize = 9,
             orientation = "landscape")

#Write data to a sheet: writeData command
#Specify Workbook object:wb option
#Name of the sheet to write: sheet option; name/index number
#Data to write: x option
#Specify the row to start reading: startRow option
#Specify column to start reading: startcol option
#Name the data range:name option
#Refer to "Save with style:write.xlsx command" for others
writeData(wb = TestWb,
          sheet = 1, x = iris,
          startRow = 3, startCol = 2,
          array = FALSE,
          colNames = TRUE, rowNames = FALSE,
          name = "からだにいいもの",
          headerStyle = CellStyle,
          borders = "columns",
          borderColour = "blue",
          borderStyle = "double",
          withFilter = TRUE,
          keepNA = TRUE)

#Fixing the window frame:freezePane command
#Save with style:write.xlsx command
freezePane(wb = TestWb,
           sheet = 1,
           firstActiveRow = 3,
           firstActiveCol = 4)

#Specify column widths:setColWidths command
#Specify column widths:widths option; "auto"/numeric
setColWidths(wb = TestWb, sheet = 1,
             cols = 2:6, widths = "auto")

#Adapt a Style Object to a specified range: addStyle command
#Create a new Style
CellStyle2 <- createStyle(fgFill = "lightblue",
                          textDecoration = "underline2")
#AdaptStyle Object
#If cols,rows range is not the same: set gridExpand option to TRUE
addStyle(wb = TestWb, sheet = 1,
         style = CellStyle2,
         rows = 8:10, cols = 2:6,
         gridExpand = TRUE)

#Adapt a Style Object with formatting rules:conditionalFormatting command
#Create a new Style
#Use the point::bgFill option
CellStyle3 <- createStyle(bgFill = "red",
                          textDecoration = "underline2")
CellStyle4 <- createStyle(bgFill = "gold",
                          textDecoration = "underline2")
CellStyle5 <- createStyle(bgFill = "green",
                          textDecoration = "underline2")
CellStyle6 <- createStyle(bgFill = "black",
                          textDecoration = "underline2")

#Specified Condition Content:type Option
#rule is "<","<=",">",">=","==","!=":"expression"
conditionalFormatting(wb = TestWb, sheet = 1,
                      style = CellStyle3,
                      cols = 2, rows = 4:30,
                      type = "expression",
                      rule = ">=5")

#Gradient with a numeric range of 2 or 3 for rule:"colourScale"
#Databar with a numeric range of 2 or 3 for rule:"databar"
conditionalFormatting(wb = TestWb, sheet = 1,
                      style = c("pink", "yellow"),
                      cols = 3, rows = 4:30,
                      type = "colourScale",
                      rule = c(3, 5))

#rule is the duplicate value:"duplicates"
#rule contains the specified value:"contains"
#rule contains a range of values specified by:"between"
conditionalFormatting(wb = TestWb, sheet = 1,
                      style = CellStyle4,
                      cols = 4, rows = 4:30,
                      type = "duplicates")

#rule begins with a letter that:"beginsWith"
#rule ends with a letter that:"endsWith"
conditionalFormatting(wb = TestWb, sheet = 1,
                      style = CellStyle5,
                      cols = 6, rows = 4:30,
                      type = "endsWith",
                      rule = "a")

#value where rule is a top value:"topN"
#value where rule is a bottom value:"bottomN"
conditionalFormatting(wb = TestWb, sheet = 1,
                      style = CellStyle6,
                      cols = 5, rows = 4:30,
                      type = "topN",
                      rank = 20, percent = TRUE)
######################

#Specify column widths: setColWidths command
#column widths:widths option; "auto"/numeric
setColWidths(wb = TestWb, sheet = 1,
             cols = 2:5, widths = "18.3")

#Insert the output of a plot or ggplot2 package: insertPlot command
#BoxPlot
BoxPlot <- ggplot(cars, aes(x = factor(speed),
                            y = dist, fill = factor(speed))) +
  geom_boxplot()

#Add BoxPlot:insertPlot command
#The number printed at the end will be inserted.
#Specify size: width,height option; units are in inches
#Use the units option to change the units
print(BoxPlot)
insertPlot(wb = TestWb, sheet = 1,
           width = 15, height = 15,
           units = "cm", xy= c("H", 7),
           fileType = "png")

#Save the xlsx file in the working directory: saveWorkbook command
saveWorkbook(wb = TestWb,
             file = "KARADA_GOOD.xlsx",
             overwrite = TRUE)
Protect, duplicate, delete, etc. xlsx files and sheets
#Set password for xlsx file:protectWorkbook command
#Specify password:password option
protectWorkbook(wb = TestWb,
                protect = TRUE,
                password = "KARADAGOOD",
                lockStructure = FALSE,
                lockWindows = FALSE)

#Set passwords, cell protection, etc. for worksheets: protectWorksheet command
#Set a password: password option
#Protect cells: lockSelectingLockedCells option
#Set other protection settings: protectWorksheet
protectWorksheet(wb = TestWb,
                 sheet = 1,
                 protect = TRUE,
                 password = "KARADAGOOD",
                 lockSelectingLockedCells = TRUE)

#Duplicate sheet: cloneWorksheet command
#Name of the copied sheet: sheetName option
cloneWorksheet(wb = TestWb,
               sheetName = "KARADAGOOD_2",
               clonedSheet = 1)

#Rename sheet:renameWorksheet command
#Target sheet:sheet option
#Renamed name:newName option
renameWorksheet(wb = TestWb,
                sheet = "KARADAGOOD_2",
                newName = "KARADAGOOD_3")

#Delete sheet:removeWorksheet command
#Target sheet:sheetName option
removeWorksheet(wb = TestWb,
                sheetName = "KARADAGOOD_2")
Other
・Hyperlink settings, etc.
#Creating Hyperlinks: getNamedRegions command
#Data containing URLs and paths are allowed.
#Data to be written is set to "hyperlink class" before writing.
class(Target data) <- "hyperlink"
#Get Creators:getCreators command
getCreators(wb = TestWb)
#Get sheet name:getSheetNames command
#set xlsx/xlsm file:file option
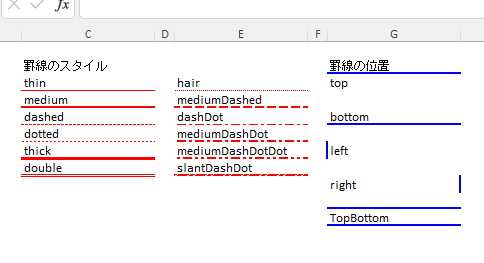
getSheetNames(file)・Border style and position: see output examples
#Create a new Excel file
TestWb <- createWorkbook()
#Add sheet
addWorksheet(wb = TestWb,
             sheetName = "KARADAGOOD",
             gridLines = FALSE,
             tabColour = "blue",
             zoom = 80)

###Border styles#####
StyleName <- c("thin", "medium", "dashed", "dotted", "thick", "double",
               "hair", "mediumDashed", "dashDot", "mediumDashDot",
               "mediumDashDotDot", "slantDashDot")

#Write character
writeData(wb = TestWb, sheet = 1, x = "Border Styles",
          startRow = 2, startCol = 3)

#Write Styles
for(i in seq(StyleName)){
  ifelse(i <= 6, Sc <- 3, Sc <- 5)
  ifelse(i <= 6, Sr <- 2 + i, Sr <- i - 4)
  #書き込み
  writeData(wb = TestWb, sheet = 1, x = StyleName[i],
            startRow = Sr, startCol = Sc)
  #Cell Style
  CellStyle <- createStyle(fontSize = 12,
                           fontColour = "black",
                           border = "bottom",
                           borderColour = "red",
                           borderStyle = StyleName[i])
  #Add Style
  addStyle(wb = TestWb, sheet = 1,
           style = CellStyle,
           rows = Sr, cols = Sc,
           gridExpand = TRUE)
}
########

###Border positions#####
AllBorder <- c("top","bottom","left","right","TopBottom")
SrNo <- c(2, 3, 4, 5, 6)

#Write character
writeData(wb = TestWb, sheet = 1, x = "Border Positions",
          startRow = 2, startCol = 7)

#Write Borders
for(i in seq(AllBorder)){
  Sr <- SrNo[i] + i
  #Write
  writeData(wb = TestWb, sheet = 1, x = AllBorder[i],
            startRow = Sr, startCol = 7)
  #Cell Style
  CellStyle <- createStyle(fontSize = 12,
                           fontColour = "black",
                           border = AllBorder[i],
                           borderColour = "blue",
                           borderStyle = "medium")
  #Add Style
  addStyle(wb = TestWb, sheet = 1,
           style = CellStyle,
           rows = Sr, cols = 7,
           gridExpand = TRUE)

}
########

#Set colomun widths
setColWidths(wb = TestWb, sheet = 1,
             cols = c(3, 4, 5, 6, 7),
             widths = c(23, 2.86, 23, 2.86, 23))

#Saved xlsx file:saveWorkbook command
saveWorkbook(wb = TestWb,
             file = "KARADAGOOD.xlsx",
             overwrite = TRUE)
・Conditional format: see output examples
#Create a new Excel file
TestWb <- createWorkbook()
#Add sheet
addWorksheet(wb = TestWb,
sheetName = "KARADAGOOD",
gridLines = FALSE,
tabColour = "blue",
zoom = 80)
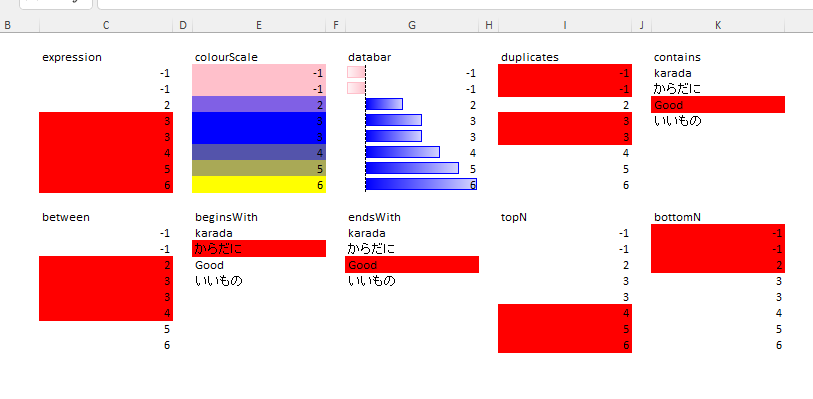
###Conditional format#####
#Conditional format
RuleName <- c("expression", "colourScale", "databar", "duplicates",
"contains", "between", "beginsWith", "endsWith",
"topN", "bottomN")
CellStyle <- createStyle(bgFill = "red")
CellStyle_BW <- createStyle(bgFill = c("pink", "blue"))
#Data position
Sr <- rep(seq(3, 11, by = 2), 2)
LSc <- rep(c(2, 12), each = 5)
Sc <- rep(c(3, 13), each = 5)
#Data write
for(i in seq(RuleName)){
#Write conditional format name
writeData(wb = TestWb, sheet = 1, x = RuleName[i],
startRow = LSc[i], startCol = Sr[i])
#Data write
if(RuleName[i] %in% c("contains", "beginsWith", "endsWith")){
writeData(wb = TestWb, sheet = 1,
x = c("karada", "からだに", "Good", "いいもの"),
startRow = Sc[i], startCol = Sr[i])
}else{
writeData(wb = TestWb, sheet = 1,
x = c(-1, -1, 2, 3, 3, 4, 5, 6),
startRow = Sc[i], startCol = Sr[i])}
}
###Adapt formatting rules#####
#"expression"
conditionalFormatting(wb = TestWb, sheet = 1,
style = CellStyle,
cols = 3, rows = 3:10,
type = "expression",
rule = ">2")
#"colourScale"
conditionalFormatting(wb = TestWb, sheet = 1,
style = c("pink", "blue", "yellow"),
cols = 5, rows = 3:10,
type = "colourScale",
rule = c(1, 3, 6))
#"databar"
conditionalFormatting(wb = TestWb, sheet = 1,
style = c("pink", "blue"),
cols = 7, rows = 3:10,
type = "databar")
#"duplicates"
conditionalFormatting(wb = TestWb, sheet = 1,
style = CellStyle,
cols = 9, rows = 3:10,
type = "duplicates")
#"contains"/"notcontainsText"
conditionalFormatting(wb = TestWb, sheet = 1,
style = CellStyle,
cols = 11, rows = 3:10,
type = "contains",
rule = "oo")
#"between"
conditionalFormatting(wb = TestWb, sheet = 1,
style = CellStyle,
cols = 3, rows = 13:20,
type = "between",
rule = c(2, 4))
#"beginsWith"
conditionalFormatting(wb = TestWb, sheet = 1,
style = CellStyle,
cols = 5, rows = 13:20,
type = "beginsWith",
rule = "か")
#"endsWith"
conditionalFormatting(wb = TestWb, sheet = 1,
style = CellStyle,
cols = 7, rows = 13:20,
type = "endsWith",
rule = "d")
#"topN"
conditionalFormatting(wb = TestWb, sheet = 1,
style = CellStyle,
cols = 9, rows = 13:20,
type = "topN",
rank = 3)
#"bottomN"
conditionalFormatting(wb = TestWb, sheet = 1,
style = CellStyle,
cols = 11, rows = 13:20,
type = "bottomN",
rank = 3)
setColWidths(wb = TestWb, sheet = 1,
cols = c(3:11),
widths = rep(c(23, 2.86), length = 9))
saveWorkbook(wb = TestWb,
file = "KARADAGOOD.xlsx",
overwrite = TRUE)Output Example
・Ruled line style and position
・Conditional format
I hope this makes your analysis a little easier !!
![東京大学のデータサイエンティスト育成講座 ~Pythonで手を動かして学ぶデ―タ分析~ | 塚本邦尊, 山田典一, 大澤文孝, 中山浩太郎, 松尾 豊[協力]](https://images-na.ssl-images-amazon.com/images/P/4839965250.09.LZZZZZZZ.jpg)