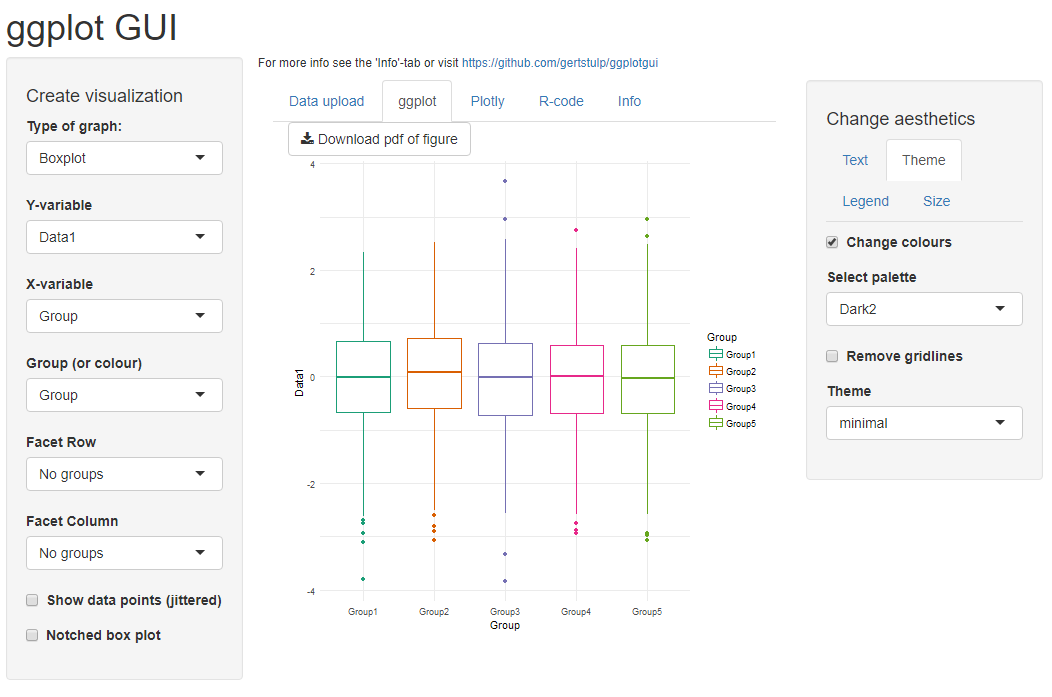
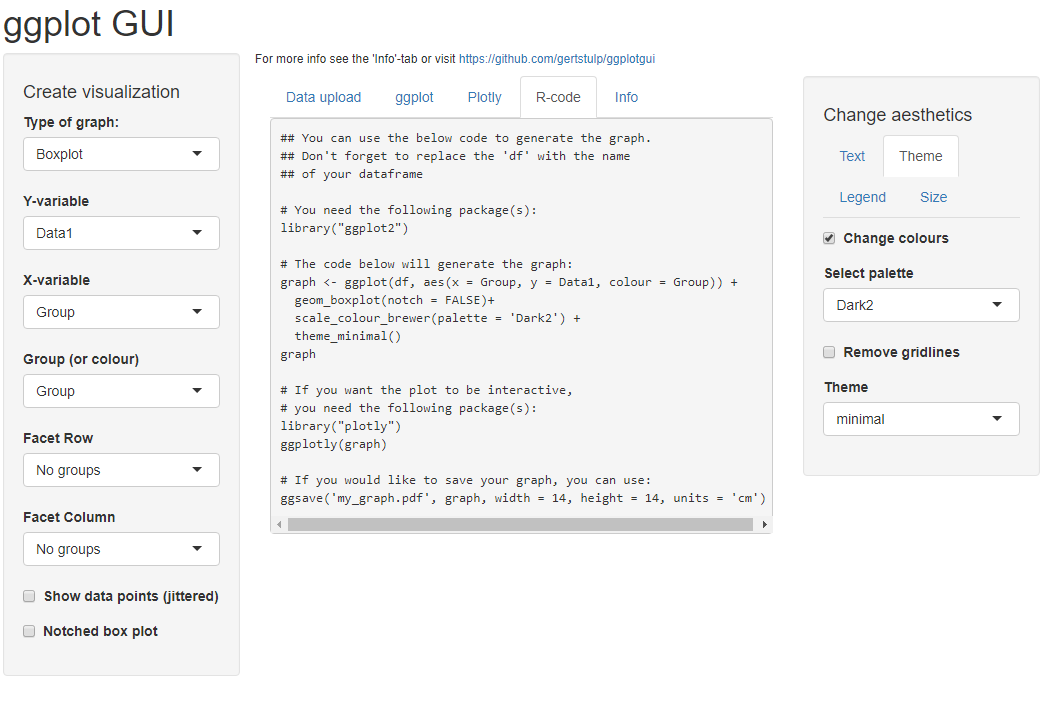
This is an introduction to a package that allows you to interactively manipulate ggplot2 from a web browser. This package is useful for learning R because you can get the code of the plot you created with “ggplot2” and “plotly”.
The color of the plot cannot be changed, but if you add the “fill” option to the code you get, there should be no problem.
Here is the article for the package that allows you to create ggplot2 interactively from your web browser.
・Analysis in R: ggplot2’s appearance can be manipulated interactively!
”ggThemeAssist” package
https://www.karada-good.net/analyticsr/r-478
・Analysis in R: ggplot2’s appearance can be manipulated interactively! Part 2
”ggedit” package
https://www.karada-good.net/analyticsr/r-586
This is a summary of the “ggplot2” package.
・Analysis in R: If you want easy and clean graphs, here is a summary of ggplot2.
https://www.karada-good.net/analyticsr/r-78
Package version is 1.0.0. R version 4.2.2 is confirmed.
Install Package
Run the following command.
#Install Package
install.packages("ggplotgui")
Execute command
See the command and package help for details.
#Package loading
library("ggplotgui")
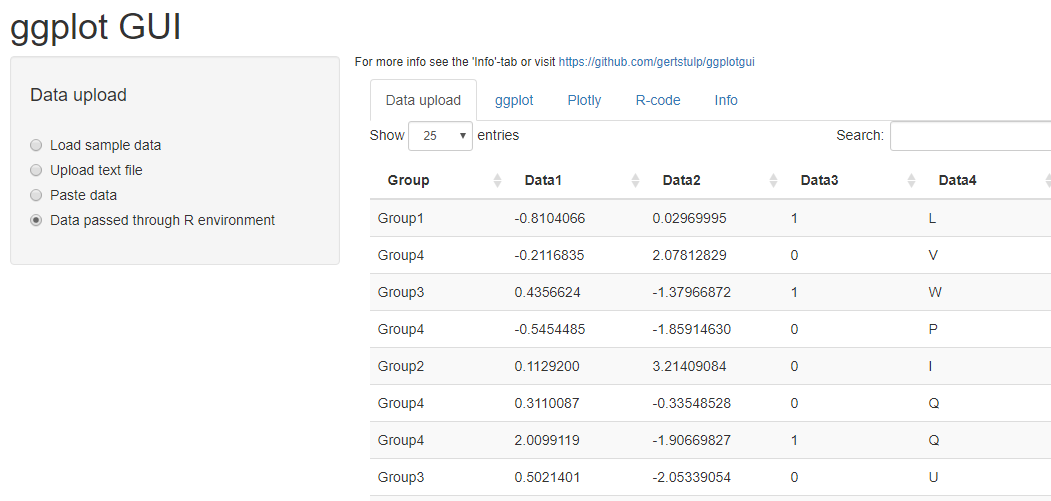
###Creating Example Data#####
n <- 3000
TestData <- data.frame(Group = sample(paste0("Group", 1:5), n, replace = TRUE),
Data1 = rnorm(n),
Data2 = rnorm(n) + rnorm(n) + rnorm(n),
Data3 = sample(0:1, n, replace = TRUE),
Data4 = sample(LETTERS[1:26], n, replace = TRUE))
#######
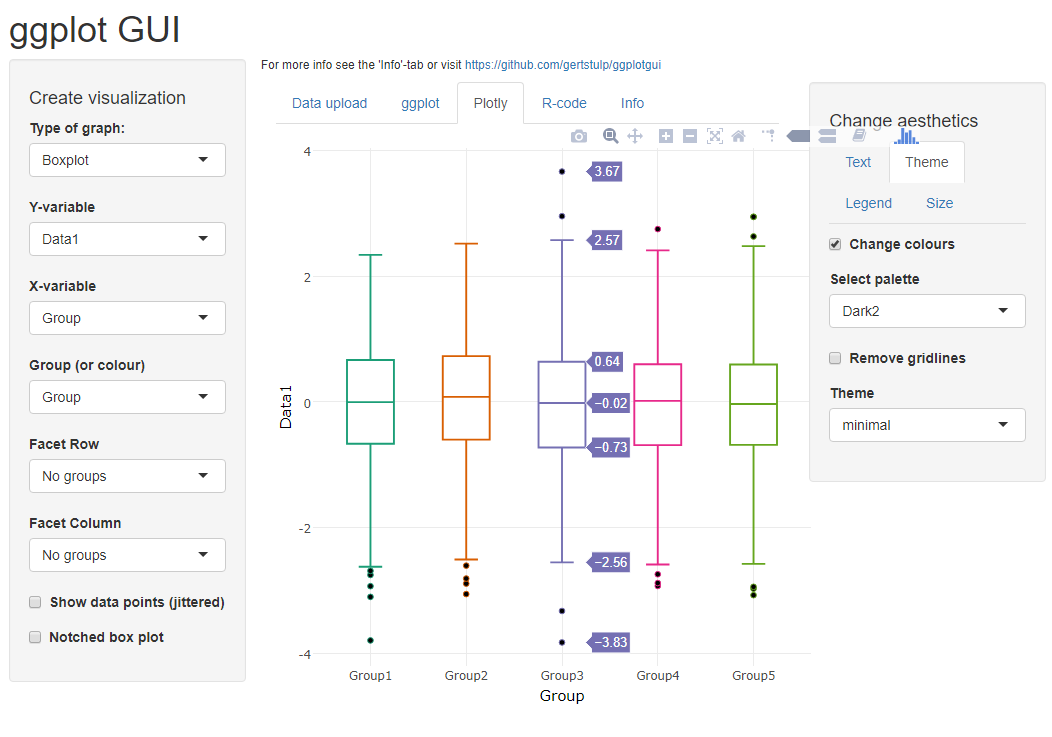
#Operating ggplot2 with GUI: ggplot_shiny command
#Set data:dataset option:Only GUI is activated in NA
ggplot_shiny(dataset = TestData)Output Examples
I hope this makes your analysis a little easier !!