This section introduces “how to create variable names (objects) and regularly assign values (data) to them” using the “assign command” and “how to command R with a string (for example, “TEST” enclosed in double quotes)” using the “eval(parse(text = “command contents”)) command. This can be useful for iterative processing such as “for” commands.
The command is checked with R version 4.2.2. No new package installation is required.
Regularly create variable names and assign values
The “assign” command is used. This section introduces the creation of vectors and data frames. See the comments for details. Note that the data is created using the “sample” command, so the contents will be different each time it is run.
#Creating Vectors
#Create Test1 to 5 objects and assign data
for( i in seq(5)){

 assign(paste("Test", i, sep = ""),
        sample(10:100, size = 10, replace = TRUE),
        env = .GlobalEnv)

}

#Of course, data frames are also possible
#Create Test1 to 5 objects and assign data
for( i in seq(5)){

  assign(paste("TestDF", i, sep = ""),
         data.frame(TEST1 = sample(10:100, size = 10, replace = TRUE),
                    TEST2 = sample(200:300, size = 10, replace = TRUE)),
         env = .GlobalEnv)

}
How to command R with a string
“eval(parse(text = “statement content”))” command. Here is an example that displays the contents of the data and outputs a scatter plot. Note that the data was created using the “Regularly create variable names and assign values” command example described above.
Although not introduced here, if processing takes a long time, consider using the “eval(substitute(do.call()))” command, which has a high processing speed.
#eval(parse(text = "命令内容")) command
#Use the cat command to label and display the contents from the created Test1
for( i in seq(5)){
cat(eval(parse(text = paste("Test", i, sep = ""))),
labels = paste("Test", i, ":", sep = ""), fill = TRUE)
}
Test1: 23 48 81 18 74 59 75 49 54 14
Test2: 28 35 16 66 29 79 88 66 58 67
Test3: 61 70 88 22 27 17 58 34 87 16
Test4: 86 77 60 41 47 73 57 41 10 43
Test5: 51 63 45 25 46 65 43 23 67 88
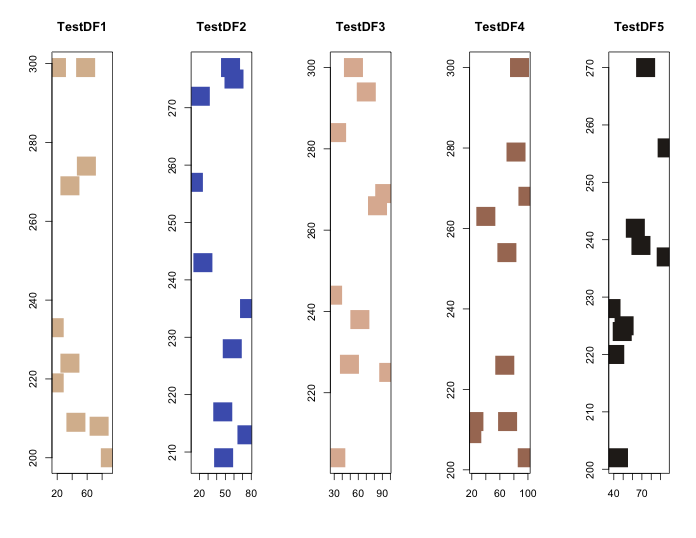
#Scatter plot of TestDF1 through 5
layout(matrix(seq(5), rep(1, 5)), 1, 5)
ColSet <- c("#d9bb9c", "#4b61ba", "#deb7a0", "#a87963", "#28231e")
for( i in seq(5)){
plot(eval(parse(text = paste("TestDF", i, "[, 1]", sep = ""))),
eval(parse(text = paste("TestDF", i, "[, 2]", sep = ""))),
xlab = "", ylab = "", main = paste("TestDF", i, sep = ""),
col = ColSet[i], pch = 15, cex = 4)
}Output Example
I hope this makes your analysis a little easier !!