Analysis in R: Useful! xml files to read in R
PubMed is a literature search site that outputs search results in xml format. xml can be edited in R, so we created code that reads article titles and abstracts from xml files of PubMed search results and outputs a csv file with tag plots and word counts. Please note that xml files other than PubMed files can also be manipulated by R, so please refer to this page as a reference example.
<おすすめのRに関する書籍です>
Preparation of the analysis
Package Introduction
- “XML” for manipulating XML files
- “tm” for English text mining
- “wordcloud” for tag cloud
- “RColorBrewer” for colour settings
*Bulk installation of packages is possible with the following code.
install.packages(c("XML", "tm", "wordcloud", "RColorBrewer"))Note that you can also install individually by specifying install.packages (“package name”).
Download xml file
- Access PubMed.http://www.ncbi.nlm.nih.gov/pubmed
- Search.
- Click Send to in the top right corner of the search results, select File→Format as xml and press Create File. You can then download the xml file.
Execute command
After running the code, you will be asked for the xml file to load and the destination folder. The result will be a csv file containing the number of word occurrences for each article title and abstract, and a tag plot in the destination folder. See the comments in the code for details.
###Loading the library#####
library("tcltk")
library("XML")
library("tm")
library("wordcloud")
library("RColorBrewer")
########
###Set the colour of the text in the tag cloud#####
Col <- brewer.pal(8, "Dark2") #Set color
########
###The "Number of occurrences of the word to plot" setting. The settings for "Paper title" and "Abstract". #####
WordFreq <- c(5, 15)
########
###Loading Data#####
selectAXlm <- paste(as.character(tkgetOpenFile(title = "Select xml File",filetypes = '{"xml File" {".xml"}}',initialfile = "*.xml")), sep = "", collapse =" ")
MasterAnaData <- xmlInternalTreeParse(selectAXlm)
########
###Set the save location#####
SaveDir <- as.data.frame(paste(as.character(tkchooseDirectory(title = "Select Folder"), sep = "", collapse =" ")))
SaveDir <- paste(SaveDir[1:(nrow(SaveDir)),], sep = " ", collapse = "/" )
setwd(SaveDir)
########
###Extract article title and abstract from xml file#####
###I think most xml operations extract element names and summarise their values. I think most of them can be supplemented with xpathSApply(). #####
#Selecting an Article Titles
Title <- as.data.frame(xpathSApply(MasterAnaData, "//ArticleTitle", xmlValue))
#Selecting an Abstract
Abstract <-as.data.frame(xpathSApply(MasterAnaData, "//AbstractText", xmlValue))
########
AnaList <- c("Title", "Abstract")
for(i in seq(AnaList)){
###Text mining settings, according to your preferences#####
#Creating a Corpus
CorMaster <- Corpus(DataframeSource(eval(parse(text = AnaList[i]))))
CorMaster <- tm_map(CorMaster, stripWhitespace) #Delete blanks
CorMaster <- tm_map(CorMaster, removeNumbers) #Delete numbers
CorMaster <- tm_map(CorMaster, removePunctuation) #Delete punctuation
CorMaster <- tm_map(CorMaster, removeWords, stopwords("english")) #Delete and, or, etc.
TermVec <- DocumentTermMatrix(CorMaster) #Aggregation of Term Matrix
########
###Data framing of word analysis results#####
AnalyticsAllWords <- as.data.frame(apply(TermVec, 2, sum)) #Aggregate word occurrence rates
AnalyticsAllWords <- cbind(rownames(AnalyticsAllWords), AnalyticsAllWords)
AnalyticsAllWords <- subset(AnalyticsAllWords, !(AnalyticsAllWords[, 1] %in% c("chlorella", "the", "this", "can", "thus", "these")) )#Set the words you want to remove
AnalyticsAllWords <- AnalyticsAllWords[sort.list(AnalyticsAllWords[, 2], decreasing=TRUE),] #Sort by number of occurrences in descending order
AnalyticsWords <- subset(AnalyticsAllWords, AnalyticsAllWords[, 2] >= WordFreq[i]) #Select at least the specified number
colnames(AnalyticsAllWords) <- c("単語", "出現数") #Set the columns name
########
png(paste(AnaList[i], ".png", seq = ""), width = 1280, height = 800) #Save plot as png
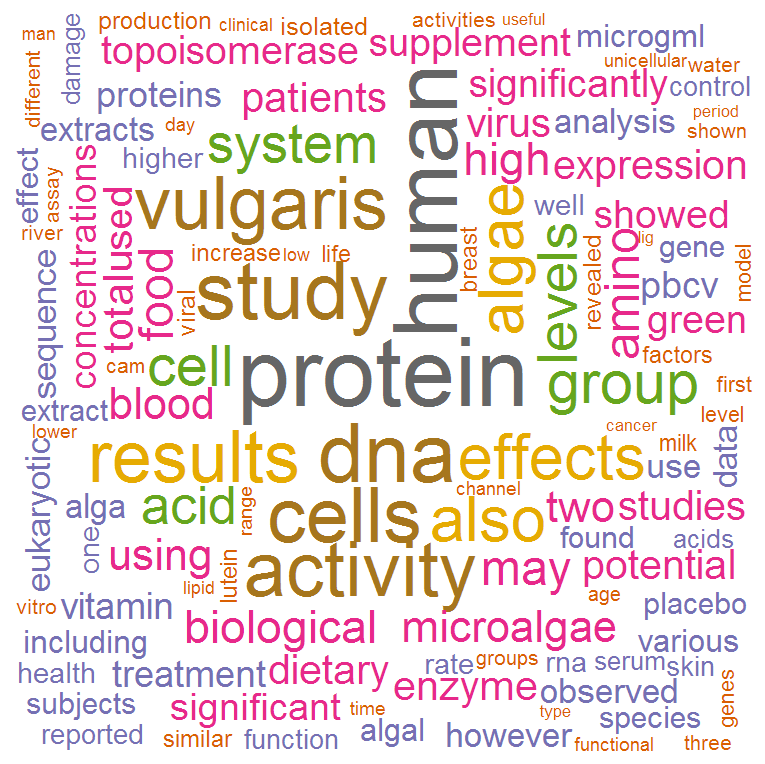
###Tag Cloud Plotting#####
wordcloud(AnalyticsWords[, 1], AnalyticsWords[, 2], scale=c(8,.2),
random.order = FALSE, rot.per = .15, colors = Col)
########
dev.off()
write.csv(AnalyticsAllWords, paste(AnaList[i], "_結果.csv", seq = ""), row.names = FALSE) #Save results in csv
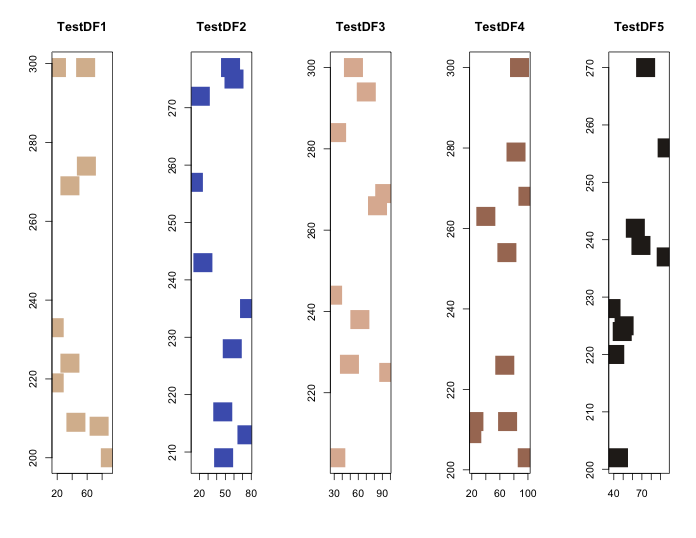
}Output Examples
The tag cloud and csv file shown in the figure will be output to the folder specified as the destination. As an additional note, in the code shown above, the number of words to be output is set to 5 or more for paper titles and 15 or more for abstracts. Please change this if necessary. You can also use R on xml files other than PubMed. Some statistical information is available in xml format. Please try it.
I hope this makes your analysis a little easier !!