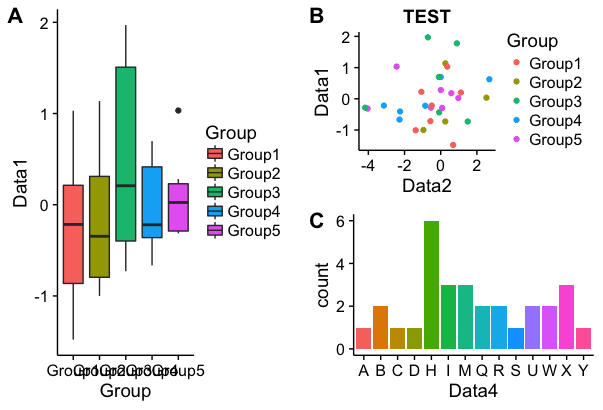
Descriptive statistics is the important task of summarising data, calculating statistics and understanding trends and characteristics. There are many ways to summarise data in descriptive statistics, but the first step is to understand the number of occurrences (distribution) of the data. By understanding the distribution it is possible to identify input errors in the data.
However, the process of figuring out the distribution of data using commercial statistical software is somewhat complicated, and syntax can be created in SPSS and other software to get output that suits the purpose. In this respect, R offers a high degree of freedom, which makes the analysis work much easier.
Therefore, introduce the “descr” package, which can reduce these tasks. This package not only displays the distribution of data in cross-tables and graphs, but also includes a command that outputs the syntax for “reproducing data processed in R using SPSS and saving it in SPSS format”. I think this is the best feature of this package.
Many universities still use SPSS for paper submissions, etc. Migrating data from R to SPSS will be easier. Please use the commands in the package.
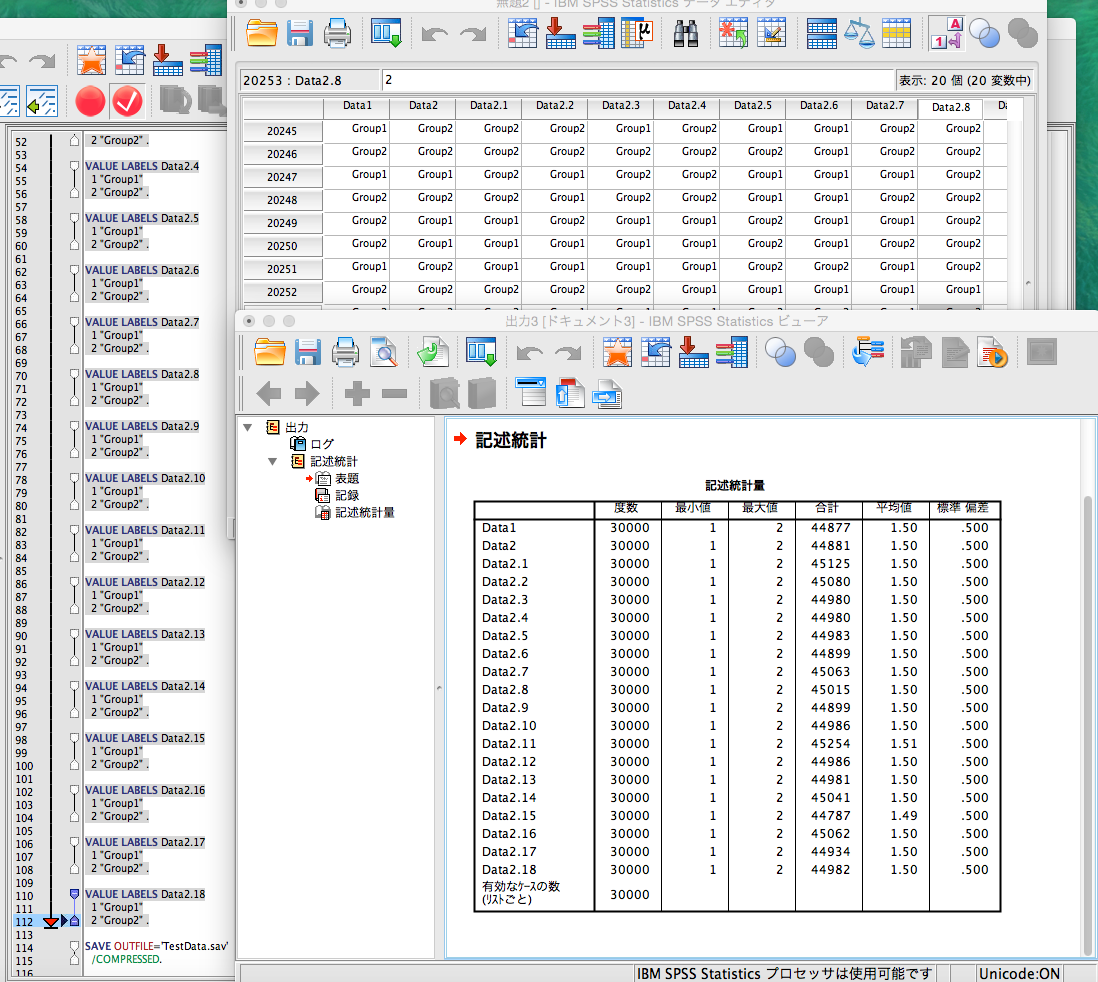
Note that we were able to reproduce the 20*30000 data created in R using syntax. However, if you use syntax, be careful where you save the text file containing the data. If you do not save the text file in the correct location, an error will occur. Please refer to the SPSS error for the correct location.
Package version is 1.1.5. Checked with R version 4.2.2.
Install Package
Run the following command.
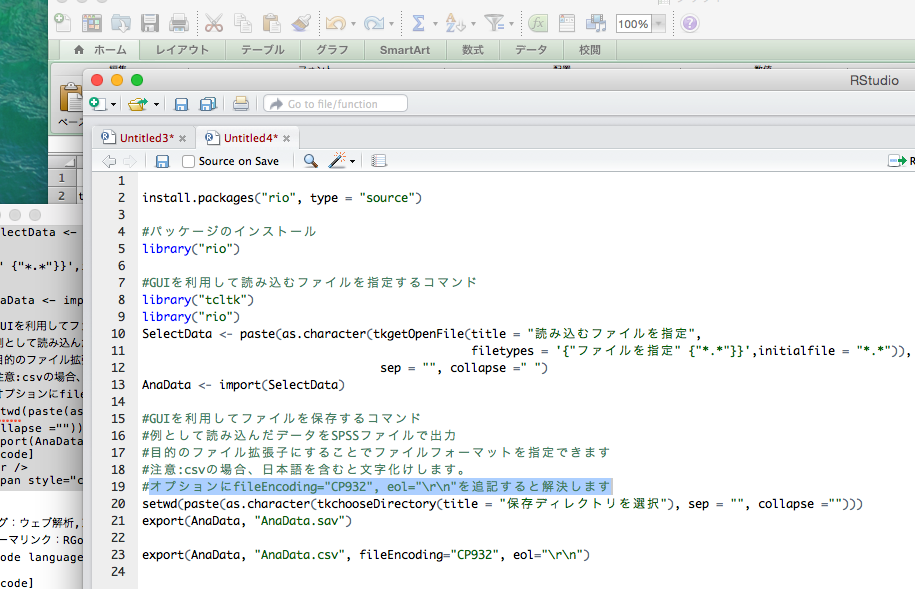
#Install Package
install.packages("descr")
Example
See the command and package help for details.
#Loading the library
library("descr")
####Creating Data#############
set.seed(12345)
TestData <- data.frame(Data1 = sample(paste0("Group", 1:2), 40, replace = TRUE),
Data2 = sample(paste0("Group", 1:2), 40, replace = TRUE))
##############################
#SPSS syntax and R command to reproduce the contents of a data frame,
#output data contents to a working folder: data.frame2txt command
#When you run the spss syntax in SPSS, be careful where you save the file,
#the output "spss" syntax is "/FILE='TestData.txt'".
#Each option is used to specify the name of the file to save.
data.frame2txt(TestData, datafile = "TestData.txt", r.codefile = "TestData.R",
sps.codefile = "TestData.sps", df.name = "TestData")
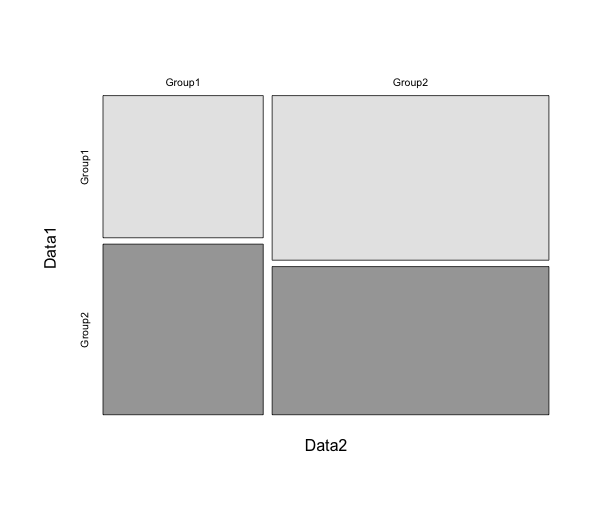
#Aggregate data in a cross table: CrossTable Command
#See Cell Contents for the numbers in the output table
PlotCT <- CrossTable(TestData[, 1], TestData[, 2], drop.levels = TRUE,
dnn = c(colnames(TestData[1]), colnames(TestData[2])))
#Graphical display of the number of occurrences
plot(PlotCT)
#Table showing the number of occurrences
PlotCT
#Cell Contents
#|-------------------------|
#| N |
#| Chi-square contribution |
#| N / Row Total |
#| N / Col Total |
#| N / Table Total |
#|-------------------------|
#=================================
#Data2
#Data1 Group1 Group2 Total
#---------------------------------
# Group1 6 6 12
# 0.117 0.159
# 0.500 0.500 0.300
# 0.261 0.353
# 0.150 0.150
#---------------------------------
# Group2 17 11 28
# 0.050 0.068
# 0.607 0.393 0.700
# 0.739 0.647
# 0.425 0.275
#---------------------------------
# Total 23 17 40
# 0.575 0.425
#=================================
#Show a summary of the data:descr command
descr(TestData)
Data1
Length Class Mode
40 character character
Data2
Length Class Mode
40 character character
#Show data frequency:freq command
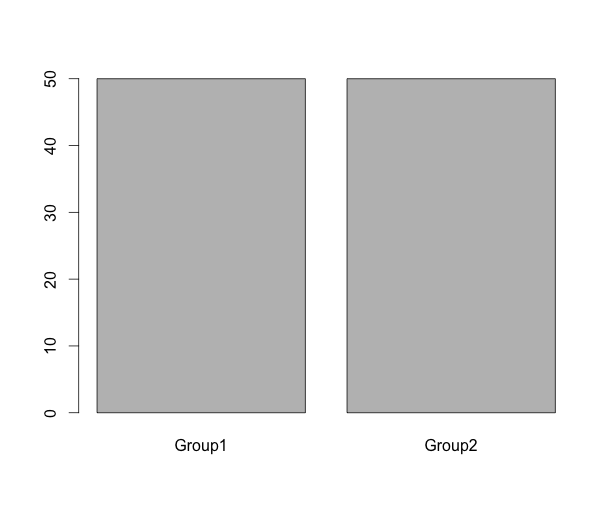
#Graphs are also output together
freq(TestData[, 1], y.axis = "percent")
#TestData[, 1]
# Frequency Percent
#Group1 12 30
#Group2 28 70
#Total 40 100Output Example
・CrossTable command
・freq command
I hope this makes your analysis a little easier !!