Academics may be familiar with APA style, but Web professionals may be wondering, “What is it? APA style is the American Psychological Association’s specification for writing research papers.
As the name “Psychological” suggests, it was originally a specification for the field of psychology, but it is now used in a wide range of academic fields because it is “a compilation of expressions that are easy for a third party to understand. Another important specification is the AIP of the American Institute of Physics.
This package saves the APA compliant table to a working folder in Word. We hope you will try the run command.
Package version is 2.0.8. Checked with R version 4.2.2.
Install Package
下記コマンドを実行してください。
#Install Package
install.packages("apaTables")
#Requires ”vctrs” package 0.5.2 or later
install.packages("vctrs")
Example
See the command and package help for details.
#パッケージの読み込み
library("apaTables")
#Show confidence interval: show.conf.interval option; TRUE/FALSE
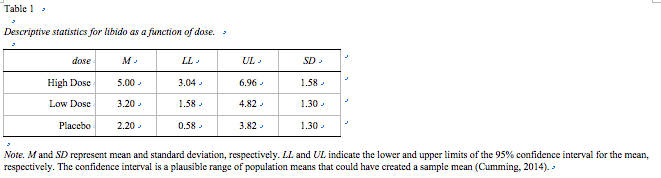
apa.1way.table(data = viagra, iv = dose, dv = libido, landscape = TRUE,
table.number = 1, show.conf.interval = TRUE,
filename = "One-WayTable.doc")
#Table output of Two-Way ANOVA results: apa.2way.table command
#Analysis data: data option
#Independent variable: iv1,iv2 option
#Dependent variable: dv option
#Output file orientation: landscape option; TRUE (horizontal)/FALSE (vertical)
#Describe table numbers: table.number option
#Show confidence interval: show.conf.interval option; TRUE/FALSE
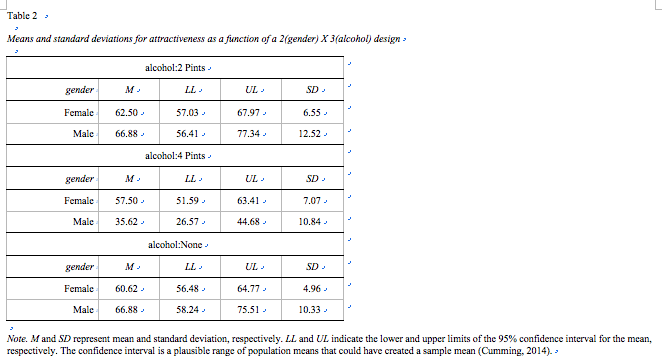
apa.2way.table(data = goggles, iv1 = gender, iv2 = alcohol, dv = attractiveness,
landscape = TRUE, table.number = 2, show.conf.interval = TRUE,
filename = "Two-WayTable.doc")
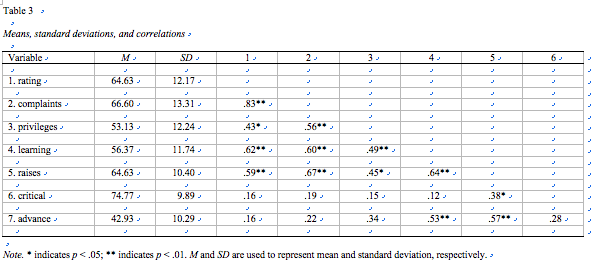
#Output Pearson coefficients to table: apa.cor.table command
#Analysis data:data option
#Output file orientation: landscape option; TRUE (horizontal)/FALSE (vertical)
#Describe table number: table.number option
#Show confidence intervals: show.conf.interval option; TRUE/FALSE
apa.cor.table(data = attitude, landscape = TRUE, table.number = 3,
show.conf.interval = FALSE, filename = "CorTable.doc")
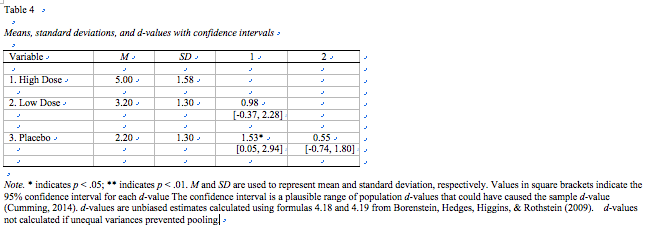
#d-values for all paired comparisons to table output:apa.d.table command
#Analysis data frame: data option
#Independent variable: iv option
#Dependent variable: dv option
#Output file orientation: landscape option; TRUE (horizontal)/FALSE (vertical)
#Describe table numbers: table.number option
#Show confidence interval: show.conf.interval option; TRUE/FALSE
apa.d.table(data = viagra, iv = dose, dv = libido, landscape = TRUE,
table.number = 4, show.conf.interval = TRUE,
filename = "DTable.doc")
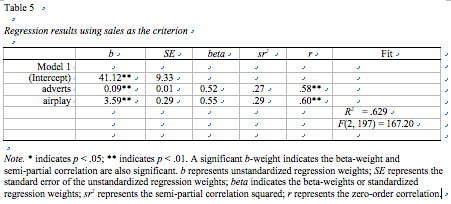
#Output regression analysis results: apa.reg.table command
#Describe table numbers: table.number option
LmResult <- lm(sales ~ adverts + airplay, data = album)
apa.reg.table(LmResult, table.number = 5, filename = "RegTable.doc")Example
・apa.1way.table command
・apa.2way.table command
・apa.cor.table command
・apa.d.table command
・apa.reg.table command
I hope this makes your analysis a little easier !!