Introducing “networkD3” package, which allows you to manipulate network diagrams interactively. It is a useful package. Here are some basic commands. Even the phylogenetic tree is interactive.
Install Package
Run the following command.
#Install Package
install.packages("networkD3")
Execute command
Will show you how to output directly and how to embed the output in HTML. The content of the graphics is the same.
#Loading the library
library("networkD3") #Required for network diagramming
library("magrittr") #Required for output in HTML
###Creating a simple network diagram#####
#Data Preparation
src <- c("A", "A", "A", "A", "B", "B", "C", "C", "D")
target <- c("B", "C", "D", "J", "E", "F", "G", "H", "I")
networkData <- data.frame(src, target)
#Plot
simpleNetwork(networkData, width = NULL, height = NULL, fontSize = 20,
textColour = "blue", linkColour = "red",
nodeColour = "green", opacity = 1, charge = -200)
#Save the graph to a working directory (i.e., working folder)
NwtworkPlot <- simpleNetwork(networkData, width = NULL, height = NULL, fontSize = 20,
textColour = "blue", linkColour = "red",
nodeColour = "green", opacity = 1, charge = -200)
saveNetwork(network = NwtworkPlot , file = 'simple.html', selfcontained = TRUE)
########
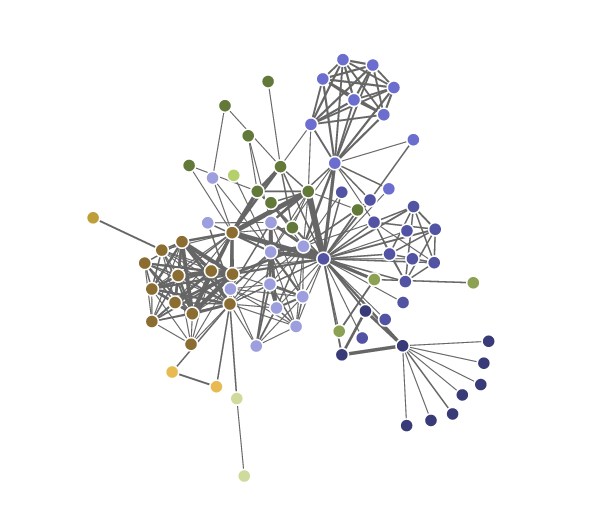
###Create complex network diagrams#####
#Load data. The forceNetwork command requires data for links and nodes.
data("MisLinks")
data("MisNodes")
#Plot
forceNetwork(Links = MisLinks, Nodes = MisNodes, Source = "source",
Target = "target", Value = "value", NodeID = "name",
Group = "group", opacity = 1,
colourScale = "d3.scale.category20b()")
#Save the graph to a working directory (i.e., working folder)
forceNetwork(Links = MisLinks, Nodes = MisNodes, Source = "source",
Target = "target", Value = "value", NodeID = "name",
Group = "group", opacity = 1,
colourScale = "d3.scale.category20b()") %>% saveNetwork(file = 'forceNetwork.html', selfcontained = TRUE)
########Output Examples
・Simple network diagram
I hope this makes your analysis a little easier !!