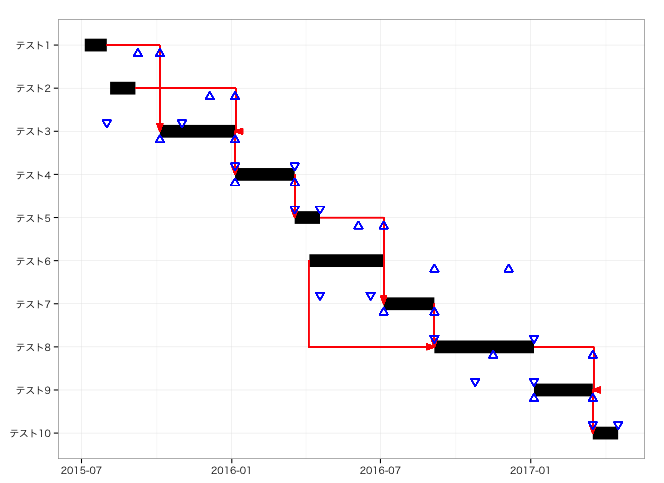
Creating Gantt charts is surprisingly difficult, but the ”PlotPrjNetworks” package makes it easy. Complex Gantt charts can be created. Please give it a try.
Package version is 1.0.0. Checked with R version 4.2.2.
Install Package
Run the following command.
#Install Package
install.packages("PlotPrjNetworks")
Example
See the command and package help for details.
#Loading the library

library("PlotPrjNetworks")

#Create project data
#Process name, start and end date data required
TasksData <- data.frame(task = paste0("Test", 1:10),
                        start = c("2015-07-05", "2015-08-05", "2015-10-05",
                                  "2016-01-05", "2016-03-18", "2016-04-05",
                                  "2016-07-05", "2016-09-05", "2017-01-05",
                                  "2017-03-18"),
                        end = c("2015-08-01", "2015-9-05", "2016-01-05",
                                "2016-03-18", "2016-04-18", "2016-07-05",
                                "2016-9-05", "2017-01-05", "2017-03-18",
                                "2017-04-18"))

#Project management data
#form,to: relationship between processes, type: method of joining lines;
#F: from the "end", S: from the "start", delay: setting of construction time delay
#The upper and lower triangular symbols shown
#for each process indicate the shortest time at
#the top and the delay tolerance at the bottom
InfoData <- data.frame(from = c(1, 2, 3, 4, 5, 6, 7, 8, 9),
                          to = c(3, 3, 4, 5, 7, 8, 8, 9, 10),
                          type = c("FS", "FF", "FS", "FS", "FS", "SS", "FS", "FF", "FS"),
                          delay = c(0, 0, 0, 0, 0, 0, 0, 0, 0))

#Plot
GanttChart(TasksData, InfoData)
Output Example
少しでも、あなたの解析が楽になりますように!!