Methods of representing color include RGB, hexadecimal notation and the Munsell Color System, invented by American art educator Albert Munsell. The “munsell” package is an easy-to-use package for working with the Munsell color system and Munsell color charts, and for creating isochromatic surfaces.
The Munsell color system is based on 10 hues, which are further divided into 10 categories of 100 hues, with 10 categories of lightness and three attributes of saturation. Colors are described as ‘hue lightness/saturation’.
・10 categories of lightness
R(red), YR(yellow-red), Y(yellow), GY(green-yellow), G(green), BG(blue-green), B(blue), PB(purple-blue), P(purple-purple), RP(red-violet)
The Munsell color system is a little difficult to understand, but checking the isochromatic areas will help you understand it better.
Package version is 0.5.0. Checked with R version 4.2.2.
Install Package
Run the following command.
#Install Package
install.packages("munsell")
Example
See the command and package help for details.
#Loading the library
library("munsell")
#Converts Munsell color notation to Hex color notation:mnsl2hex command
mnsl2hex("5PB 5/10")
[1] "#447DBF"
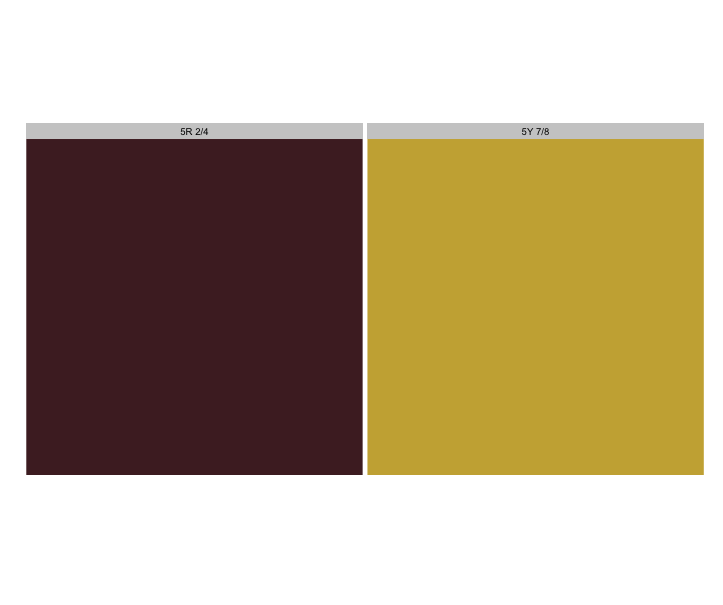
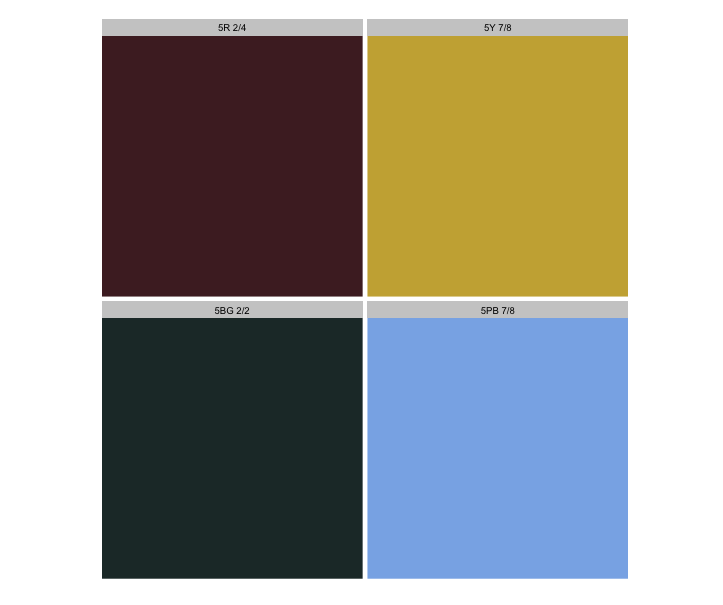
#Plot Munsell color notations:plot_mnsl command
#Back color:back.col option
plot_mnsl(c("5R 2/4", "5Y 7/8"), back.col = "white")
#Plot Hex color notations:plot_hex command
plot_hex("#23C8F5")
#Complement Color:complement command
cols <- c("5R 2/4", "5Y 7/8")
plot_mnsl(c(cols, complement(cols, fix = TRUE)))
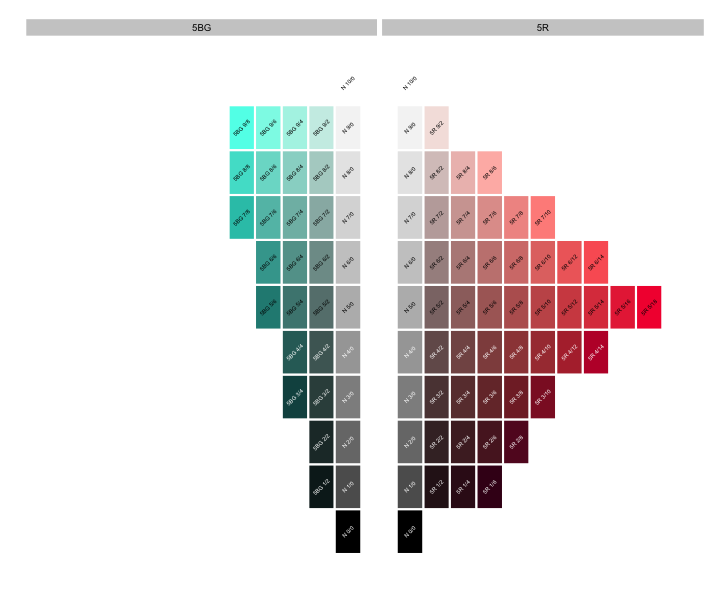
#All complementary colors in the isochromatic plane:complement_slice command
complement_slice("5R")
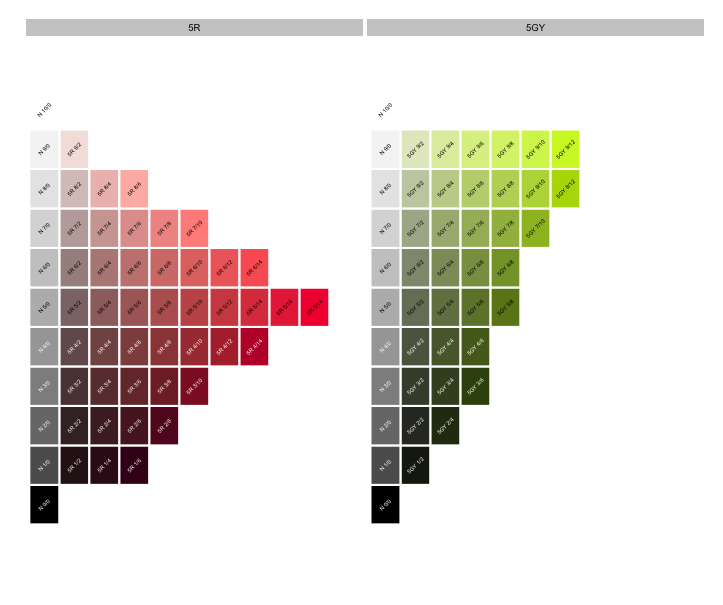
#All hues are isochromatic surfaces:hue_slice command
hue_slice(c("5R", "5GY"))
#Increase brightness:lighter command
cols <- c("5PB 2/4", "5Y 7/8")
plot_mnsl(c(cols, lighter(cols)))
#Decrease brightness:darker command
cols <- c("5PB 2/4", "5Y 7/8")
plot_mnsl(c(cols, darker(cols)))
#Increase chroma by two:saturate command
cols <- c("5PB 2/4", "5Y 7/8")
plot_mnsl(c(cols, saturate(cols)))
#Decrease chroma by two:desaturate command
cols <- c("5PB 2/4", "5Y 7/8")
plot_mnsl(c(cols, desaturate(cols)))
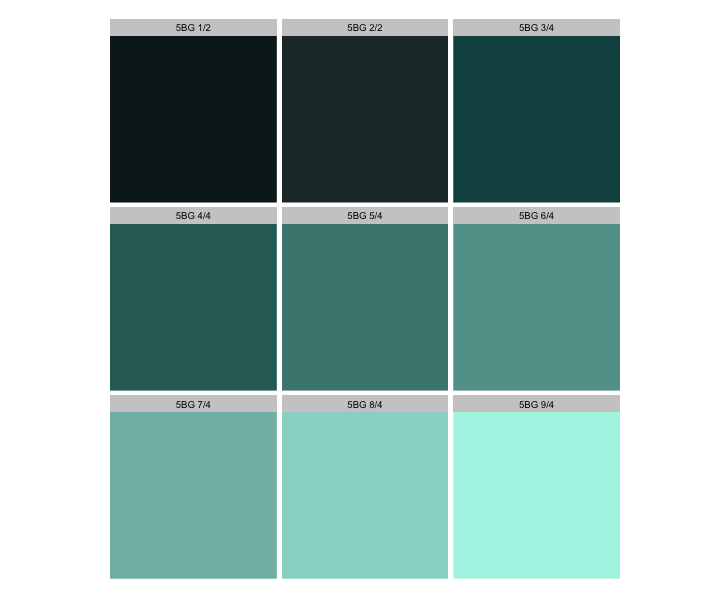
#Color palette by specifying brightness and saturation:hvc2mnsl command
#brightness:valueオプション
#chroma:chromaオプション
plot_mnsl(hvc2mnsl("5BG", value = 1:9, chroma = 4, fix = TRUE))Output Example
・plot_mnsl command
・plot_hex command

・complement command
・complement_slice command
・hue_slice command
・hvc2mnsl command
I hope this makes your analysis a little easier !!