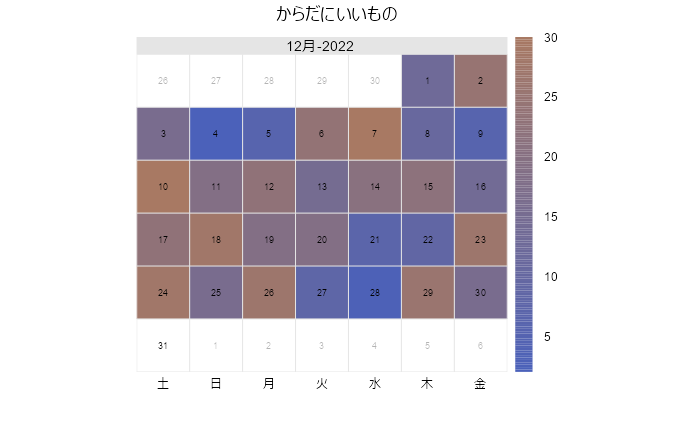
The “calendarPlot” command included in this package can easily heat map your calendar.
It may be interesting to plot readily available temperature and precipitation data on a calendar.
Package version is 2.14. Checked with R version 4.2.2.
Install Package
Run the following command.
#Install Package
install.packages("openair")
Examples
See the command and package help for details.
#Loading the library
library("openair")
###Creating Data#####
#Install the lubridate package if it is not already present
if(!require("lubridate", quietly = TRUE)){
install.packages("lubridate");require("lubridate")
}
#Install the tidyverse package if it is not already present
if(!require("tidyverse", quietly = TRUE)){
install.packages("tidyverse");require("tidyverse")
}
set.seed(1234)
n <- 30
TestData <- tibble(date = seq(lubridate::ymd("2022-12-01", locale = "C",
tz = "Asia/Tokyo"),
by = "1 day", length.out = n),
Data = sample(1:30, n, replace = TRUE))
########
#Convert date to Date class
TestData[, 1] <- as.Date(TestData[, 1], tz = "Japan")
#Plot
calendarPlot(TestData, pollutant = "Data",
annotate = "date",
day = "weekend",
cols = c("#4b61ba", "#a87963"),
main = "からだにいいもの")Output Example
I hope this makes your analysis a little easier !!