Analysis in R: Summary value box plot “lvplot” package
It is a convenient way to express data distribution.
You can use commands from the “ggplot2” package. This is useful for checking the data distribution.
Package version is 0.2.0.9000. Checked with R version 4.1.2.
Install Package
Run the following command.
#Install Package
install.packages("devtools")
devtools::install_github("hadley/lvplot")
スポンサーリンク
Example
See the command and package help for details.
#Loading the library
library("lvplot")
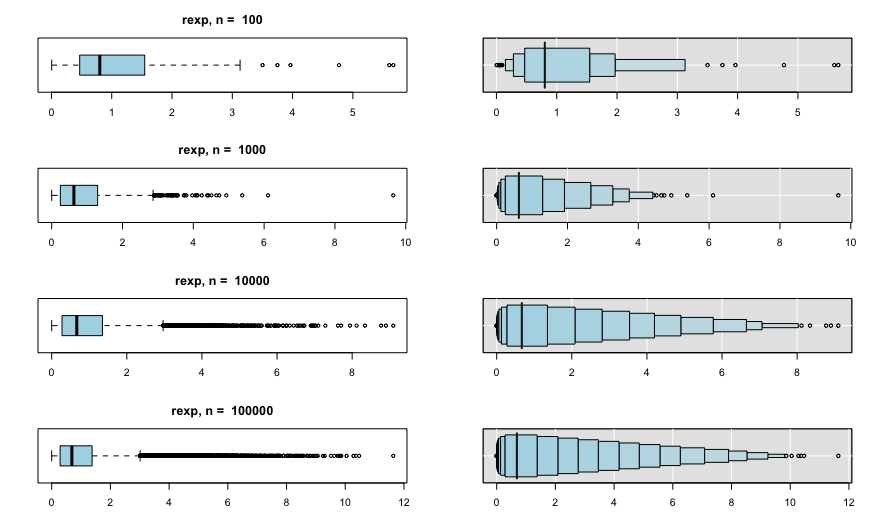
#Summary value box plot: LVboxplot command
par(mfrow = c(4,2), mar = c(3,3,3,3))
for (i in 1:4) {
x <- rexp(10 ^ (i + 1))
boxplot(x, col = "lightblue", horizontal = TRUE)
title(paste("rexp, n = ", length(x)))
LVboxplot(x, col = "lightblue", xlab = "")
}
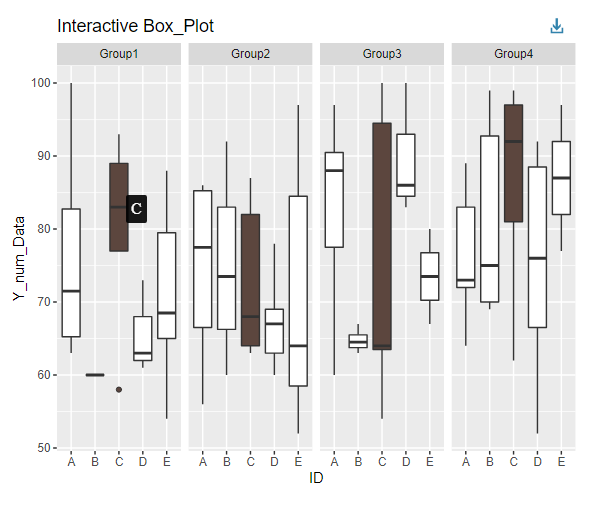
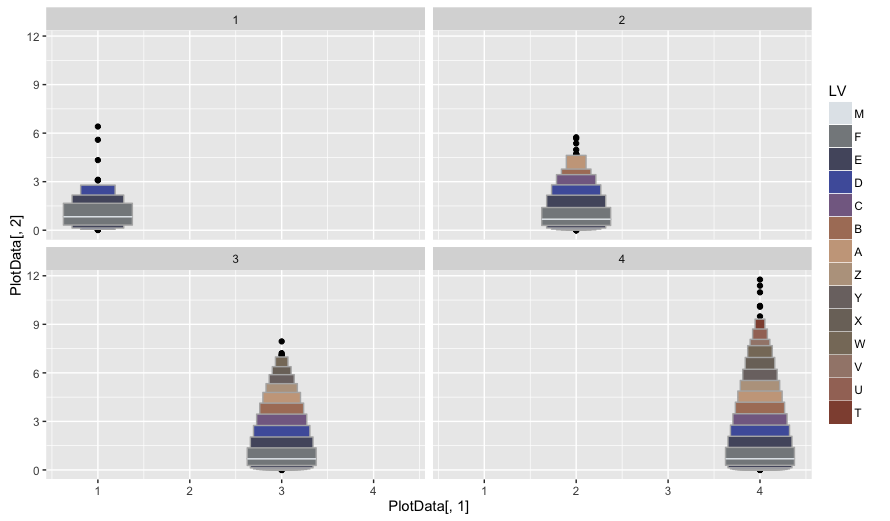
#Plotting with ggplot2: geom_lvplot command
#Install the tidyverse package if it is not already present
if(!require("tidyverse", quietly = TRUE)){
install.packages("tidyverse");require("tidyverse")
}
#Create Color pallet
#Install the scales package if it is not already present
if(!require("scales", quietly = TRUE)){
install.packages("scales");require("scales")
}
###Creating Data#####
PlotData <- NULL
for (i in 1:4) {
EXPData <- cbind(i, rexp(10 ^ (i + 1)))
PlotData <- rbind(PlotData, EXPData)
}
PlotData <- as.data.frame(PlotData)
#######
ggplot(PlotData, aes(PlotData[, 1], PlotData[, 2])) +
geom_lv(aes(fill=..LV..)) +
scale_fill_manual(values = seq_gradient_pal(c("#e1e6ea", "#505457", "#4b61ba", "#a87963",
"#d9bb9c", "#756c6d", "#807765", "#ad8a80"))(seq(0, 1, length = 14))) +
facet_wrap(~i)Output Example
・LVboxplot command
・geom_lvcommand
I hope this makes your analysis a little easier !!

スポンサーリンク