ggplot2

スポンサーリンク
RAnalytics

Analysis in R: Shall we make a Raincloud? The “ggrain” package

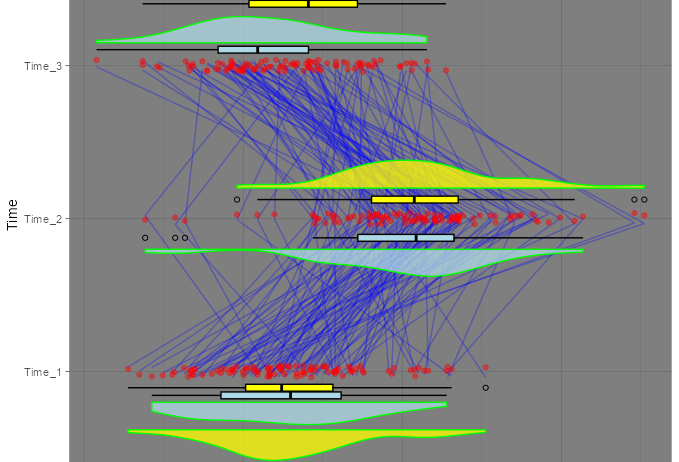
This is an introduction to a package that creates a "Raincloud" that uses a combination of boxplot, ...
RAnalytics

Analysis in R: Focus on a specific group! The “ggfocus” package

This is an introduction to the "ggplot2" package, which allows you to easily create graphs that focu...
RAnalytics

Analysis in R: Very useful for understanding the situation of missing values in data. The “ggmice” package

Introducing a package that allows you to create plots that are very useful for understanding the sta...
RAnalytics

Analysis in R: ggplot2 interactive! The “ggiraph” package

This package makes the graphs in the "ggplot2" package interactive. The example shows the "ggom_poin...
RAnalytics

Analysis in R: Scatter plots of pie charts! The “scatterpie” package

This is an introduction to a package that creates scatter plots of pie charts. It is a very interest...
RAnalytics

Analysis in R: Summary value box plot “lvplot” package

It is a convenient way to express data distribution. You can use commands from the "ggplot2" package...
RAnalytics

Analysis in R: The “gghighlight” package is useful for highlighting parts of the plot.

This package is useful for creating graphs that highlight specified areas. Commands from the 'ggplot...
RAnalytics

Analysis in R: Add significance bars to ggplot2 plots! The “ggsignifr” package

Introduces a package that adds a significant difference symbol to the plots of the "ggplot2" package...
RAnalytics

Analysis in R: Summary of Color Specification Methods in ggplot2

This is a quick summary of how to specify col and fill colors in ggplot2, which is often forgotten. ...
RAnalytics

Analysis in R: Representing data features as circles. The “packcircles” package

This is an introduction to a package that displays the characteristics of data as a circle. Note tha...
スポンサーリンク