This is an introduction to the “ggplot2” package, which allows you to easily create graphs that focus on specific groups. For example, you can create a scatterplot that shows a particular group in color and other groups in black and white. It is a useful package.
Package version is 1.0.0. Checked with R version 4.2.2.
Install Package
Run the following command.
#Install Package
install.packages("ggfocus")
Example
See the command and package help for details.
#Loading the library
library("ggfocus")
###Create Data#####
#Install the tidyverse package if it is not already there
if(!require("tidyverse", quietly = TRUE)){
install.packages("tidyverse");require("tidyverse")
}
set.seed(1234)
n <- 50
TestData <- tibble(Group = sample(paste0("Group", 1:4), n,
replace = TRUE),
X_num_Data = sample(c(1:50), n, replace = TRUE),
Y_num_Data = sample(c(51:100), n, replace = TRUE))
#Create base ggplot
#Scatter plot
Point_Plot <- ggplot(TestData, aes(x = X_num_Data, y = Y_num_Data)) +
geom_point()
#Bar chart
Column_Plot <- ggplot(TestData, aes(x = X_num_Data, y = Y_num_Data,
fill = Group)) +
geom_col()
#Line plot
Line_Plot <- ggplot(TestData, aes(x = 1:50, y = Y_num_Data,
group = Group, linetype = Group)) +
geom_line()
########
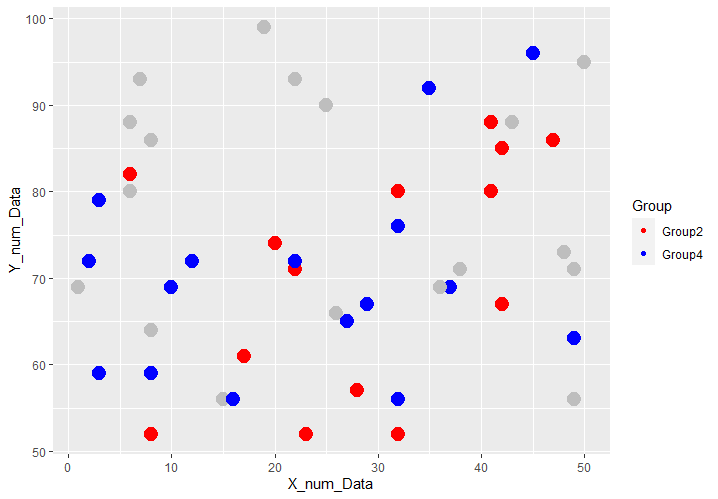
#Attention in scatter plot: scale_color_focus command
#Specify target: focus_levels option; specified by string
#Specify color: color_focus option
Point_Plot + aes(colour = Group, size = 5) +
scale_color_focus(focus_levels = c("Group2", "Group4"),
color_focus = c("red", "blue")) +
guides(size = "none")
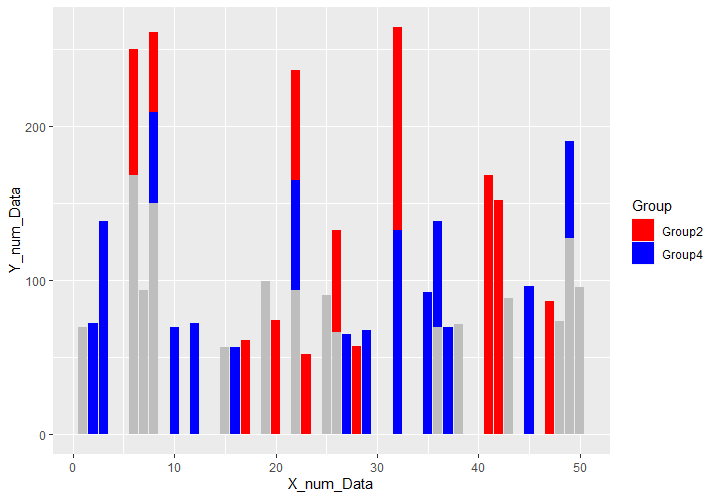
#Attention in bar chart: scale_fill_focus command
#Specify target: focus_levels option; specified by string
#Specify color: color_focus
Column_Plot +
scale_fill_focus(focus_levels = c("Group2", "Group4"),
color_focus = c("red", "blue"))
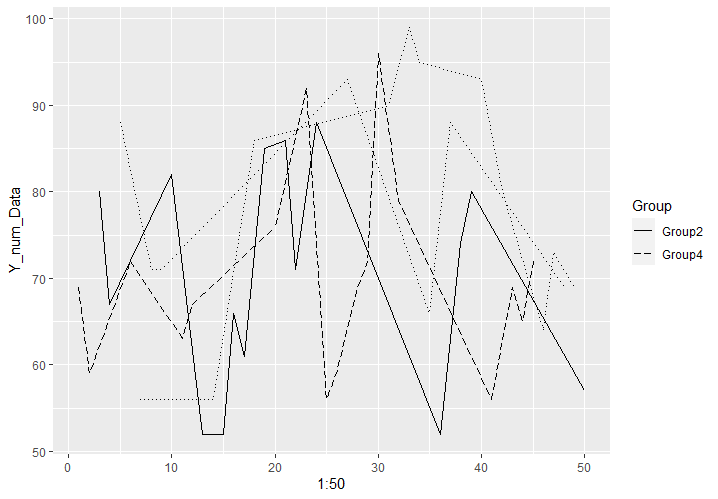
#Attention in line plot: scale_linetype_focus command
#Point to specify group, linetype for aes in the model
#Specify target:focus_levels option; specified by string
#Specify target linetype: linetype_focus option
#Specify other linetypes: linetype_other option
Line_Plot +
scale_linetype_focus(focus_levels = c("Group2", "Group4"),
linetype_focus = c(5, 1),
linetype_other = 3)
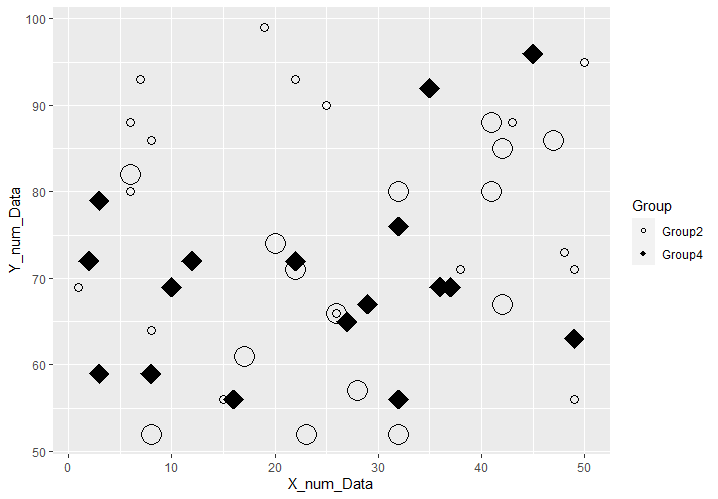
#Focus on symbol type and size: scale_shape_focus command &
#scale_size_focus command
##scale_shape_focus command
#Specify target symbols:shape_focus option
#Specify symbols not in focus: shape_other option
Point_Plot + aes(size = Group, shape = Group) +
scale_shape_focus(focus_levels = c("Group2", "Group4"),
shape_focus = c(18, 21), shape_other = 1) +
##scale_size_focus command
#Specify target symbol size: size_focus option
#Specify symbol size outside of target: size_other option
scale_size_focus(focus_levels = c("Group2", "Group4"),
size_focus = 7, size_other = 3)Output Example
・scale_color_focus command
・scale_fill_focus command
・scale_linetype_focus command
・scale_shape_focus command & scale_size_focus command
I hope this makes your analysis a little easier !!