This is an introduction to a package that creates a “Raincloud” that uses a combination of boxplot, half-violin and point plots to represent data.
The commands of the “ggplot2” package are available, making it easy to customise the appearance.
Package version is 0.0.2. Checked with R version 4.2.2.
Install Package
Run the following command.
#Install Package
install.packages("ggrain")
Example
See the command and package help for details.
#Loading the library
library("ggrain")
###Create Data#####
#Install the tidyverse package if it is not already there
if(!require("tidyverse", quietly = TRUE)){
install.packages("tidyverse");require("tidyverse")
}
set.seed(1234)
n <- 100
TestData <- tibble(Group = sample(paste0("Group ", 1:2), n, replace = TRUE),
Time_1 = rnorm(n) - 1.5,
Time_2 = rnorm(n),
Time_3 = rnorm(n) - 1.5,) %>%
rowid_to_column("ID") %>%
pivot_longer(!c(Group, ID), names_to = "Time", values_to = "Value")
########
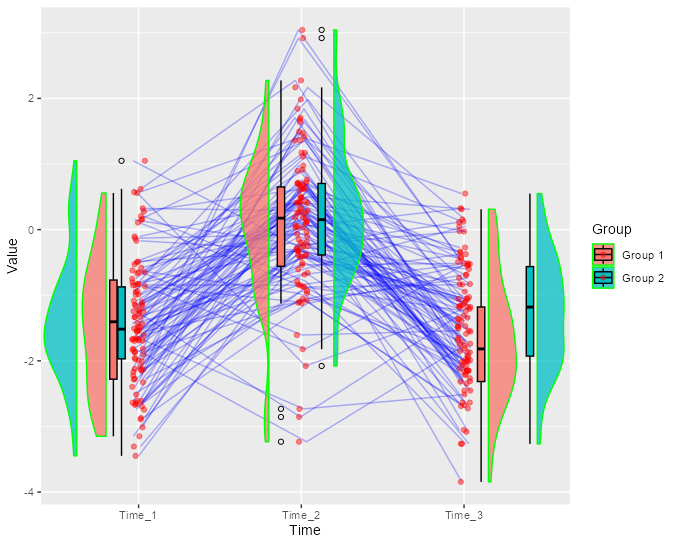
###Creating Raincloud: geom_rain command#####
#Used in conjunction with ggplot2
ggplot(TestData, aes(x = Time, y = Value,
fill = Group, color = Group)) +
#geom_rain command
geom_rain(
#How to plot a boxplot,violinplot: raine.side option
#right: "r",left: "l",flanking: "f",
#1-by-1 flanking: "f1x1",2-by-2 flanking: "f2x2"
rain.side = "f",
#Connect point plot with line based on indicator: id.long.var option
id.long.var = "ID",
#Specify color based on point plot index: cov option
#Invalid if color is specified with the point.args option
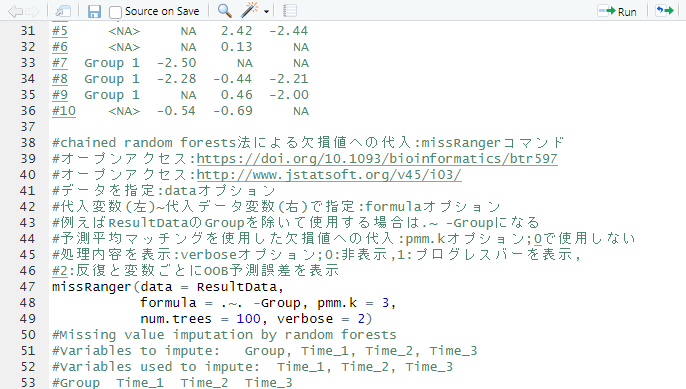
cov = "ID",
###Start_Formatting options for each plot#####
#pointplot: point.args option
point.args = list(color = "red", size = 1.5,
alpha = 0.45),
#boxplot: boxplot.args option
boxplot.args = list(color = "black",
outlier.shape = TRUE),
#violinplot:violin.args option
violin.args = list(color = "green", alpha = 0.75),
#id.long.var: line.args option
line.args = rlang::list2(color = "blue", size = 0.5,
alpha = 0.3),
###End_Formatting options for each plot#####
###Start_Positioning options for each plot#####
#Some raine.side options are invalid for "f1x1" and "f2x2#
#pointplot: point.args.pos option
point.args.pos = list(position = position_jitter(width = 0.04,
height = 0)),
#boxplot: boxplot.args.pos option
boxplot.args.pos = list(width = 0.1,
#Using the position_dodgenudge command from the ggpp package
#Each axis is 0-based, 2Group in the example,
#x=c(Time1:Group1 position, Time2:Group2 position,...)
position = ggpp::position_dodgenudge(x = c(-.13, -.13,
-.10, .10,
.13, .38))),
#violinplot: violin.args.pos option
violin.args.pos = list(width = 0.4,
#Using the position_nudge command from the ggplot2 package
position = position_nudge(x = c(rep(-.2, 256*2),
rep(-.38, 256*2),
rep(-.2, 256*2),
rep(.2, 256*2),
rep(.15, 256*2),
rep(.45, 256*2)))),
#id.long.var: line.args.pos option
line.args.pos = list(position = position_jitter(width = 0.04,
height = 0)),
###End_Positioning options for each plot#####
) -> BaseRaincloud
#Check
BaseRaincloud
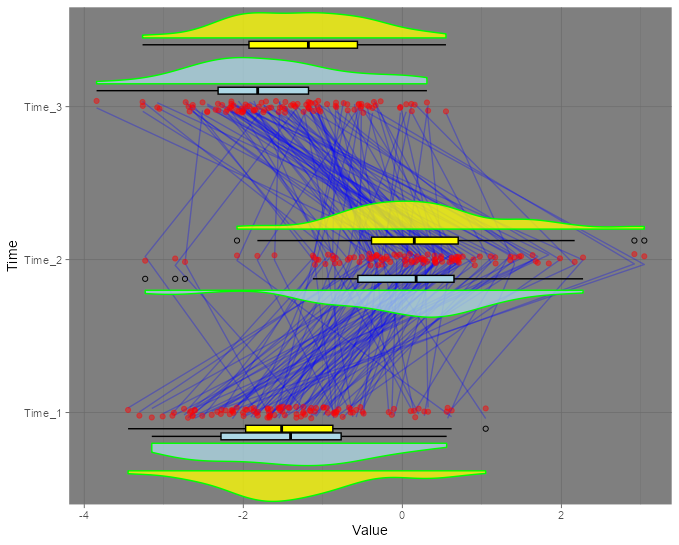
###Adjusting the appearance of BaseRaincloud with the ggplot2 command#####
BaseRaincloud +
#boxplot,violinplot change fill color
scale_fill_manual(values = c("lightblue", "yellow")) +
#Hide legend
guides(fill = "none", color = "none") +
#Apply Theme
theme_dark() +
#Coord flip
coord_flip()
########Output Example
・geom_rain command
・Adjusting the appearance of BaseRaincloud with the ggplot2 command#
I hope this makes your analysis a little easier !!