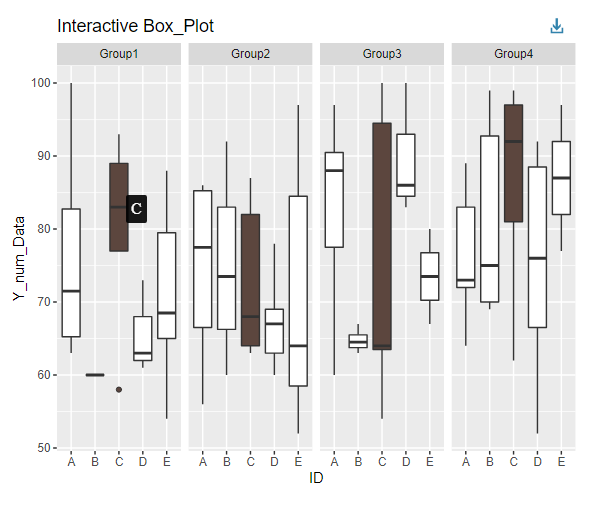
This package makes the graphs in the “ggplot2” package interactive. The example shows the “ggom_point_interactive” and “ggom_boxplot_interactive” commands to make ggom_point and ggom_boxplot interactive, and the command to save them as html files in a working folder.
This package includes many commands. Please refer to the following HP for commands that cannot be fully introduced.
ggiraph:https://davidgohel.github.io/ggiraph/index.html
Package version is 0.8.6. Checked with R version 4.2.2.
Install Package
Run the following command.
#Install Package
install.packages("ggiraph")
Example
Please check the comments and the package help for details. If the characters displayed on click are not UTF-8, an error occurs. The “stri_enc_toutf8” command from the “stringi” package is used to avoid character errors.
The “saveWidget” command of the “htmlwidgets” package is used to save the results as an html file.
#Loading the library
library("ggiraph")
###Create Data#####
#Install the tidyverse package if it is not already there
if(!require("tidyverse", quietly = TRUE)){
install.packages("tidyverse");require("tidyverse")
}
#Install the stringi package if it is not already there
if(!require("stringi", quietly = TRUE)){
install.packages("stringi");require("stringi")
}
set.seed(1234)
n <- 100
TestData <- tibble(Group = sample(paste0("Group", 1:4), n,
replace = TRUE),
ID = sample(LETTERS[1:5], n, replace = TRUE),
X_num_Data = sample(c(1:30), n, replace = TRUE),
Y_num_Data = sample(c(51:100), n, replace = TRUE)) %>%
#Tooltip Data
mutate(Tooltip = paste0( "Group Nmae<br>", Group)) %>%
#Show clic Data
mutate(Click = stri_enc_toutf8(sprintf("alert(\"X Value: %s。<br>Y Value: %s\")",
round(X_num_Data, 2), round(Y_num_Data, 2))))
########
##geom_point_interactive command
#Scatter Plot
ggplot(TestData, aes(x = X_num_Data, y = Y_num_Data,
color = Group)) +
geom_point() +
labs(x = "Data1", y = "Data2", title = "TEST PLOT", color = "Group Name")
###Interactive#####
#Add aes option
#Show mouse-over infomation: tooltip option
#Show click infomation: onclick option
PlotData <- ggplot(TestData,
aes(x = X_num_Data, y = Y_num_Data,
color = Group, tooltip = Tooltip,
onclick = Click))
#Interactive scatterplot: geom_point_interactive command
PlotData <- PlotData +
geom_point_interactive() +
labs(x = "Data1", y = "Data2",
title = "Interactive Point_Plot", color = "Group Name")
#Plotting interactive graphs: girafe command
girafe(ggobj = PlotData)
##########################################################
##geom_boxplot_interactive command
#BoxPlot
ggplot(TestData, aes(x = ID, y = Y_num_Data,
fill = ID)) +
geom_boxplot() + facet_grid(~Group) +
labs(x = "Data1", y = "Data2", title = "TEST PLOT", color = "Group Name")
###Interactive#####
#Show Group: data_id option
PlotData <- ggplot(TestData,
aes(x = ID, y = Y_num_Data,
tooltip = ID, data_id = ID))
#Interactive box plot: geom_boxplot_interactive command
PlotData <- PlotData +
geom_boxplot_interactive() +
facet_grid(~Group) +
labs(x = "ID", y = "Y_num_Data",
title = "Interactive Box_Plot", fill = "Group Name")
#Plot interactive graph: girafe command
#Set mouse-over color: opts_hover option
girafe(ggobj = PlotData,
options = list(
opts_hover(css = "fill:#5c463e;cursor:pointer;")))
##########################################################
###Save in working folder with html file#####
#Install the htmlwidgets package if it is not already there
if(!require("htmlwidgets", quietly = TRUE)){
install.packages("htmlwidgets");require("htmlwidgets")
}
#saveWidget command to save
#girafe command with widget option
saveWidget(file = "geom_boxplot_interactive.html",
widget = girafe(ggobj = PlotData,
options = list(
opts_hover(css = "fill:#5c463e;cursor:pointer;"))))Output Example
・geom_point_interactive command
Click on a point to view the data.
・geom_boxplot_interactive command
When you mouse over a box plot, the color of the box plot with the same ID changes.
I hope this makes your analysis a little easier !!


