Introducing a package that allows you to create plots that are very useful for understanding the status of missing values in your data. You can create pattern displays of missing values, inflow-outflow plot, and correlations between data.
Package version is 0.0.1. Checked with R version 4.2.2.
Install Package
Run the following command.
#Install Package
install.packages("ggmice")
Example
See the command and package help for details.
#Loading the library
library("ggmice")
###Create Data#####
#Install the tidyverse package if it is not already there
if(!require("tidyverse", quietly = TRUE)){
install.packages("tidyverse");require("tidyverse")
}
set.seed(12345)
n <- 300
TestData <- tibble(Group = sample(paste0("Group", 1:2), n,
replace = TRUE),
Data1 = sample(c(1:50, NA), n, replace = TRUE),
Data2 = sample(c(LETTERS, NA), n, replace = TRUE),
Data3 = sample(c(100:150, NA), n, replace = TRUE))
########
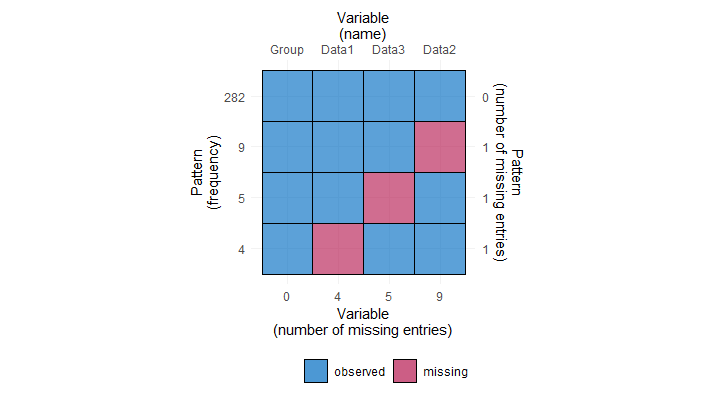
#Show missing values in a pattern: plot_pattern command
#Select data to plot:vrb option; specify column names if necessary
#Square/rectangle of cells:square option; TRUE: square/FALSE: rectangle
#Rotate variable labels by 90 degrees:rotate option;TRUE/FALSE
plot_pattern(data = TestData, vrb = "all",
square = TRUE, rotate = FALSE)
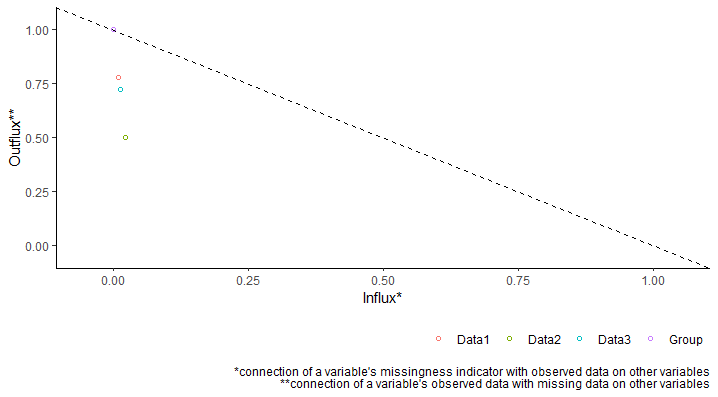
#Create influx-outflux plot: plot_flux command
#See:https://cran.r-project.org/web/packages/ggmice/vignettes/ggmice.html
#Symbol label plot position: label option; in plot: TRUE
plot_flux(data = TestData, vrb = "all",
label = FALSE, caption = TRUE)
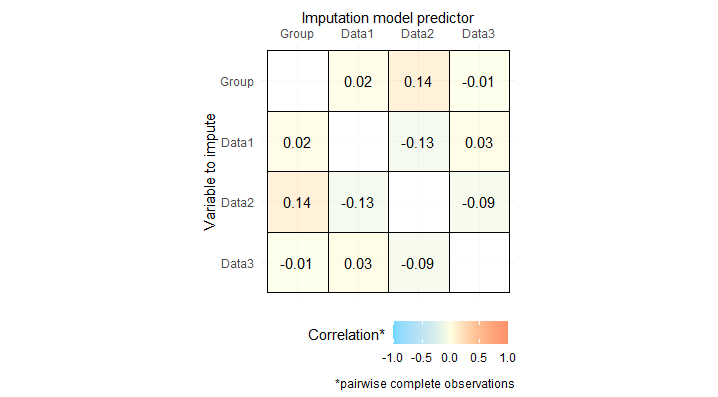
#Display correlation between data: plot_corr command
#Display correlation coefficients: label option
#Display correlations between the same data: diagonal option
plot_corr(data = TestData, vrb = "all",
square = TRUE, rotate = FALSE,
label = TRUE, diagonal = FALSE)Output Example
・plot_pattern command
・plot_flux command
・plot_corr command
I hope this makes your analysis a little easier !!