Analysis in R: The “gghighlight” package is useful for highlighting parts of the plot.
This package is useful for creating graphs that highlight specified areas. Commands from the ‘ggplot2’ package are available. A sample command to create a highlighted scatterplot without using this package is also presented.
Package version is 0.3.2. Checked with R version 4.1.2.

Install Package
Run the following command.
#Install Package
install.packages("gghighlight")
スポンサーリンク
Example
See the command and package help for details.
#Loading the library
library("gghighlight")
###Creating Data#####
#Install the tidyverse package if it is not already present
if(!require("tidyverse", quietly = TRUE)){
install.packages("tidyverse");require("tidyverse")
}
set.seed(1234)
n <- 300
PointData <- tibble(ID = rep(1:5, len = n),
Group = sample(c("A", "B", "C"),
n, replace = TRUE),
Time_A = abs(rnorm(n)),
Time_B = log2(abs(rnorm(n))))
########
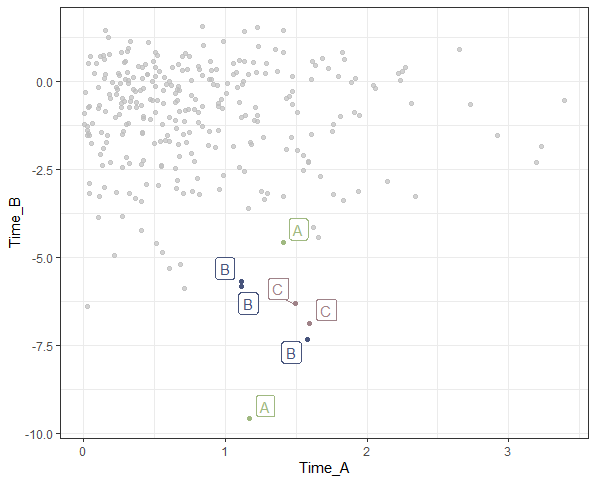
#To set data highlighting: gghighlight command
#Assigning plot labels: label_key option
ggplot(PointData, aes(x = Time_A, y = Time_B, colour = Group)) +
geom_point() +
gghighlight(Time_A > .8 & Time_B < -4.5) +
scale_colour_manual(values = c("#a0b981", "#47547c", "#9f8288")) +
theme_bw()
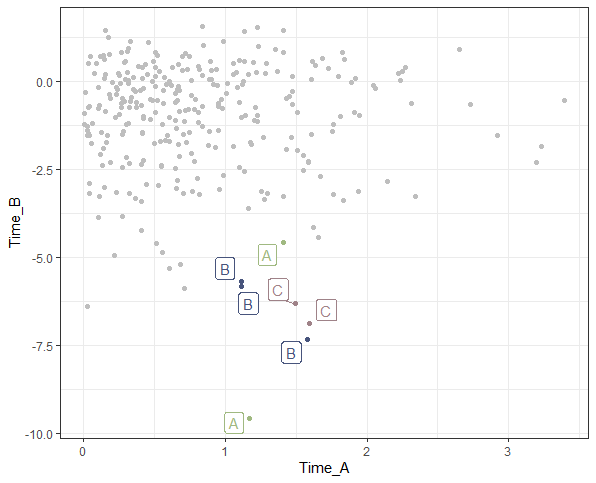
###Example: Creating scatter plots without using the gghighlight package#####
MendoiPointData <- PointData %>%
#The use of the if_else and case_when commands is key
#case_when is specified by ”conditional expression ~ result”
mutate(col = if_else(Time_A > .8 & Time_B < -4.5,
case_when(Group == "A" ~ "#a0b981",
Group == "B" ~ "#47547c",
Group == "C" ~ "#9f8288"), "gray")) %>%
mutate(Label = if_else(Time_A > .8 & Time_B < -4.5, as.character(Group), ""))
#The 'ggrepel' package for labelling
#https://www.karada-good.net/analyticsr/r-377
#Install the ggrepel package if it is not already present
if(!require("ggrepel", quietly = TRUE)){
install.packages("ggrepel");require("ggrepel")
}
#scale_colour_identity command is the key
MendoiPlot <- ggplot(MendoiPointData, aes(x = Time_A, y = Time_B,
label = Label, col = col))
MendoiPlot +
geom_point() +
geom_label_repel() +
scale_colour_identity(guide = "none") +
theme_bw()
########Output Example
・gghighlight command
・Creating scatter plots without using the gghighlight package
I hope this makes your analysis a little easier !!

スポンサーリンク