からだにいいもの
 Rで解析:要約値箱ひげ図のプロット「lvplot」パッケージ
Descriptionでletter value boxplotと記述があり、要約値箱ひげ図という表現が良いのか悩みます。データ分布を表現する一つの手段で便利な表現方法です。
基本プロットだけでなく「ggplot2」パッケージのコマンドを利用することができます。データ分布の確認に便利です。
パッケージバージョンは0.2.0.9000。実行コマンドはwindows 11のR version 4.1.2で確認しています。
<おすすめのRに関する書籍です>

生命科学・生物工学のための 間違いから学ぶ実践統計解析: R・Pythonによるデータ処理事始め (New paradigm! On-demand publishing)
よくある誤用や勘違いを起点に統計を学び直す一冊。R・Pythonの両方でデータ処理を扱う。
 www.amazon.co.jp
パッケージのインストール
下記コマンドを実行してください。
#パッケージのインストール
install.packages("devtools")
devtools::install_github("hadley/lvplot")
スポンサーリンク
実行コマンド
詳細はコマンド内を確認ください。
#パッケージの読み込み
library("lvplot")

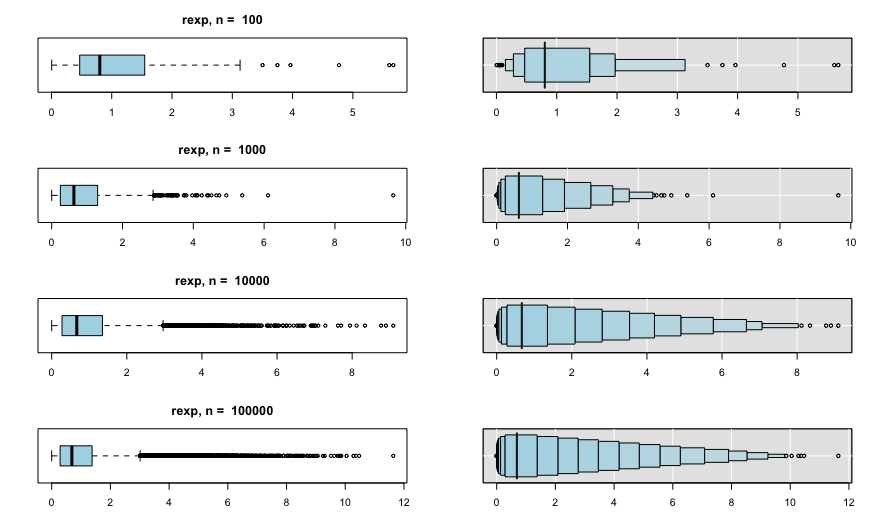
#要約値箱ひげ図のプロット:LVboxplotコマンド
par(mfrow = c(4,2), mar = c(3,3,3,3))
for (i in 1:4) {
  x <- rexp(10 ^ (i + 1))
  boxplot(x, col = "lightblue", horizontal = TRUE)
  title(paste("rexp, n = ", length(x)))
  LVboxplot(x, col = "lightblue", xlab = "")
}

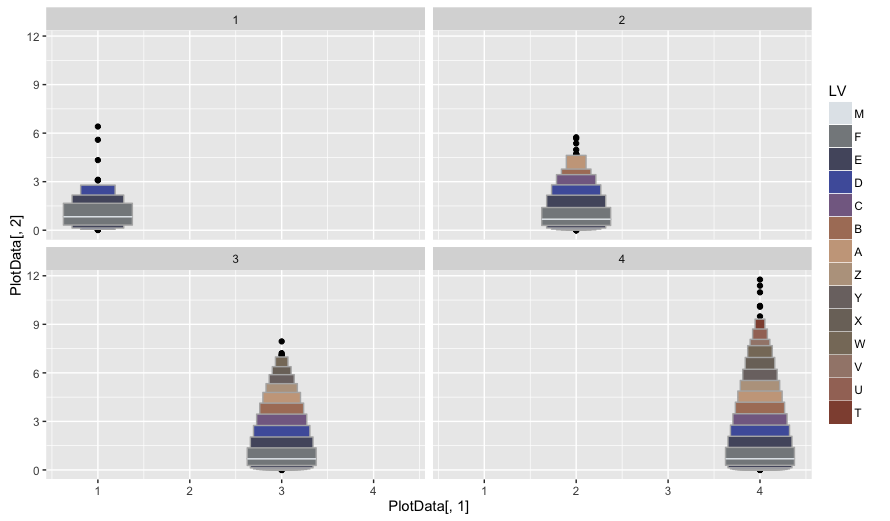
#ggplot2でプロット:geom_lvplotコマンド
#tidyverseパッケージがなければインストール
if(!require("tidyverse", quietly = TRUE)){
  install.packages("tidyverse");require("tidyverse")
}
#カラーパレット作製
#scalesパッケージがなければインストール
if(!require("scales", quietly = TRUE)){
  install.packages("scales");require("scales")
}

###プロットデータの作製#####
PlotData <- NULL
for (i in 1:4) {

  EXPData <- cbind(i, rexp(10 ^ (i + 1)))
  PlotData <- rbind(PlotData, EXPData)

}
PlotData <- as.data.frame(PlotData)
#######
ggplot(PlotData, aes(PlotData[, 1], PlotData[, 2])) +
  geom_lv(aes(fill=..LV..)) +
  scale_fill_manual(values = seq_gradient_pal(c("#e1e6ea", "#505457", "#4b61ba", "#a87963",
                                                "#d9bb9c", "#756c6d", "#807765", "#ad8a80"))(seq(0, 1, length = 14))) +
  facet_wrap(~i)
出力例
・LVboxplotコマンド
・geom_lvコマンド
少しでも、あなたのウェブや実験の解析が楽になりますように!!
スポンサーリンク