This is an introduction to the ggplot2 package for displaying the results of a principal component analysis in Biplot.
Package version is 0.55. Checked with R version 4.2.2.

Install Package
Run the following command.
#Install Package
install.packages("devtools")
devtools::install_github("vqv/ggbiplot")
Example
See the command and package help for details.
#Loading the library
library("ggbiplot")
###Creating Data#####
set.seed(1234)
TestData <- matrix(rnorm(1000), 200)
TestData <- as.data.frame(TestData)
#Data Adjustment
TestData[1:67,] <- TestData[1:67,] + 1
TestData[68:135,] <- TestData[68:135,] + 2
TestData[136:200,] <- TestData[136:200,] + 3
#Assign group information
TestData <- cbind(c(rep("Group1", 67),
rep("Group2", 67),
rep("Group3", 66)),
TestData)
colnames(TestData) <- c("Group", paste0("ColName", seq(5)))
########
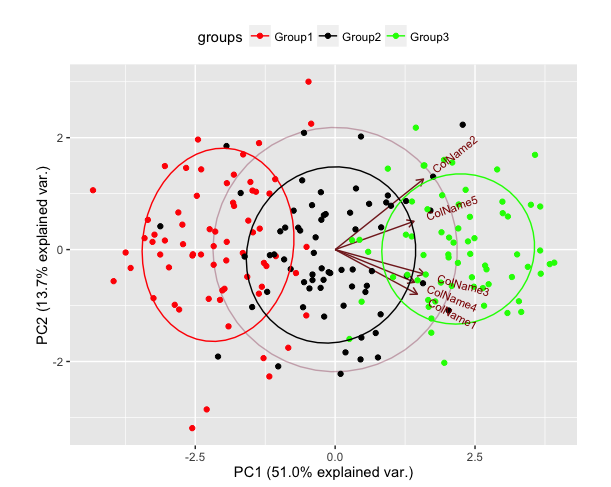
#Package stat: Principal component analysis with prcomp command
TestPrc <- prcomp(TestData[, 2:6], scale. = FALSE)
#Creating a biplot: ggbiplot command
#Specifies the result of prcomp() or princomp(): pcobj option
#Specify principal components to plot: choices option
#Specify group information: groups option
#Draw probability ellipses for each group: ellipse option
#Plot correlated circles: circle option
#The ggplot2 command is available
ggbiplot(pcobj = TestPrc, choices = 1:2, obs.scale = 1, var.scale = 1,
groups = TestData[, 1], ellipse = TRUE, circle = TRUE) +
scale_colour_manual(values = c("#FF0000", "black", "#00FF00")) +
theme(legend.direction = "horizontal", legend.position = "top")Output Example
・ggbiplot command
I hope this makes your analysis a little easier !!