This is an example of a command to create a 2-axis plot using only the “ggplot2” package. The “scale_y_continuous” command and the “sec.axis” command are used.
The “tidyverse” package version is 1.3.2, confirmed with R version 4.2.2.

Install Package
Run the following command.
#Install Package
install.packages("tidyverse")
Example
See the command and package help for details.
#Loading tidyverse package containing ggplot2
library("tidyverse")

###Creating Data#####
set.seed(1234)
n <- 50
TestData <- tibble(Group = sample(paste0("Group ", 1:5), n, replace = TRUE),
                   Data = 1:n,
                   Data1 = 1:n,
                   Data2 = rnorm(n))
########

#Second axis adjustment variable
SecondScale <- max(TestData$Data1)/max(TestData$Data2)

ggplot(TestData, aes(x = Data)) +
  #Data1 is the first axis
  stat_summary(aes(y = Data1, fill = Group), fun = "mean",
               geom = "bar", position = "stack") +

  #Data2 is the second axis
  geom_line(aes(y = Data2*SecondScale), col = "blue", size = 4) +

  #2-axis adjustment
  scale_y_continuous(name = "Data1 = sample(0:26, n, replace = TRUE)",
                     sec.axis = sec_axis(trans = ~./SecondScale,
                                         breaks = seq(-10, 10, by = 1),
                                         name = "Data2 = rnorm(n)")) +
  #Axis adjustment by theme
  theme(
    #2-axis
    axis.title.y.right = element_text(color = "red",
                                      angle = -90)
    )
Output Example
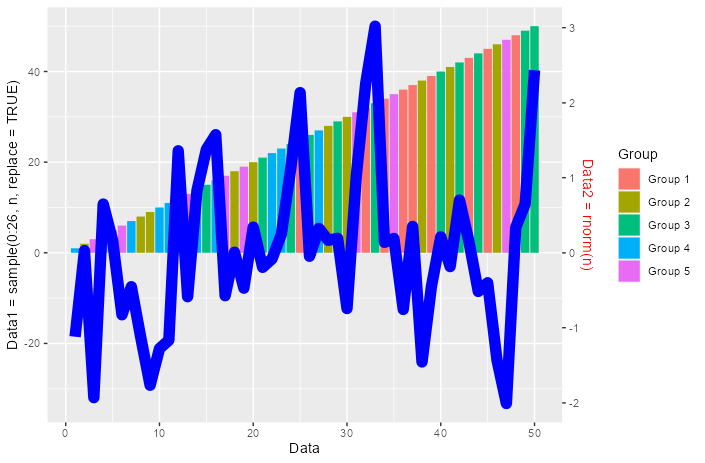
I hope this makes your analysis a little easier !!