Introducing the apply function, which is useful for sequential processing of rows or columns of data frames.
Execution commands are verified with R version 4.2.3.
Example
See the command and package help for details.
###Exsample Data#####
TestData <- data.frame(Group = rep(LETTERS[1:4], time = 2),
                       Data_1 = rep(1:4, time = 2),
                       Data_2 = rep(5:8, time = 2))
#Check
TestData
#   Group Data_1 Data_2
# 1     A      1      5
# 2     B      2      6
# 3     C      3      7
# 4     D      4      8
# 5     A      1      5
# 6     B      2      6
# 7     C      3      7
# 8     D      4      8
#######

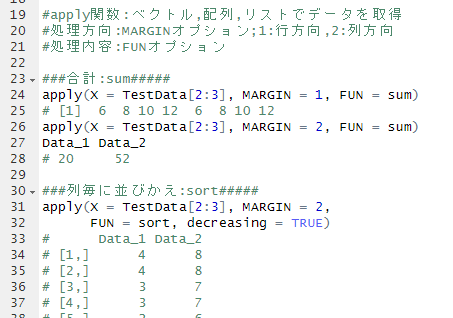
#apply function: get data as vector, array or list
#processing direction:MARGIN option; 1:row direction, 2:column direction
#processing content:FUN option

###sum#####
apply(X = TestData[2:3], MARGIN = 1, FUN = sum)
# [1]  6  8 10 12  6  8 10 12
apply(X = TestData[2:3], MARGIN = 2, FUN = sum)
Data_1 Data_2
# 20     52

###sort#####
apply(X = TestData[2:3], MARGIN = 2,
      FUN = sort, decreasing = TRUE)
#      Data_1 Data_2
# [1,]      4      8
# [2,]      4      8
# [3,]      3      7
# [4,]      3      7
# [5,]      2      6
# [6,]      2      6
# [7,]      1      5
# [8,]      1      5

###Total by group#####
apply(X = TestData[2:3], MARGIN = 2,
      FUN = function(x){tapply(x, TestData$Group, sum,
                               na.rm = TRUE)})
#   Data_1 Data_2
# A      2     10
# B      4     12
# C      6     14
# D      8     16
I hope this makes your analysis a little easier !!


