Analysis in R: Presents an example of obtaining color data from a plot
Here is a simple example of how to get a color code from a plot. The packages used are “grid” and “KaradaColor”. The key is the “grid” package.
Each package is up to date at the time of introduction, and execution commands are verified with R version 4.2.3.
![東京大学のデータサイエンティスト育成講座 ~Pythonで手を動かして学ぶデ―タ分析~ | 塚本邦尊, 山田典一, 大澤文孝, 中山浩太郎, 松尾 豊[協力]](https://images-na.ssl-images-amazon.com/images/P/4839965250.09.LZZZZZZZ.jpg)
Example
See the command and package help for details.
#Install the grid package if it is not already present
if(!require("grid", quietly = TRUE)){
install.packages("grid");require("grid")
}
#Install the KaradaColor package if it is not already present
if(!require("KaradaColor", quietly = TRUE)){
install.packages("KaradaColor");require("grid")
}
#Create triad color with specified color:KaradaColor::kg_create_tc command
#Create data to be retrieved from clicked coordinates
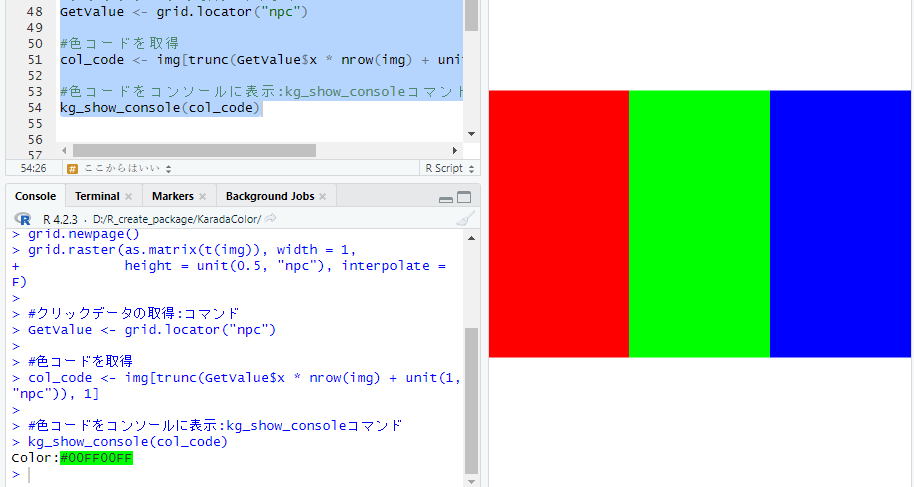
img <- kg_create_tc(basecols = "green")
#Plot: grid::grid.newpage, grid::grid.raster command
grid.newpage()
grid.raster(as.matrix(t(img)), width = 1,
height = unit(0.5, "npc"), interpolate = F)
#Capturing click data: grid::grid.locator command
GetValue <- grid.locator("npc")
#Get color code from data
col_code <- img[trunc(GetValue$x * nrow(img) + unit(1, "npc")), 1]
#Display color codes on console: KaradaColor::kg_show_console command
kg_show_console(col_code)スポンサーリンク
Output Example
I hope this makes your analysis a little easier !!

スポンサーリンク