The ggplot2 package is a very powerful plotting package, but if you are not familiar with many of its commands, it can take a long time to do decorations and other tasks. This package solves those problems.
This package allows you to easily set the axis scale of the plot, position the plot in the line direction when using the facet_wrap command, display two plots side by side, plot on two axes, set the color of the auxiliary graph lines, and more.
Package version is 0.2.1. Checked with R version 4.1.2.
Install Package
Run the following command.
#Install Package
install.packages("devtools")
devtools::install_github("trinker/plotflow")
Example
See the command and package help for details.
#Loading the library
library("plotflow")
###Creating Data#####
n <- 100
TestData <- data.frame(Group = sample(paste0("Group ", 1:5), n, replace = TRUE),
Data1 = sample(0:26, n, replace = TRUE),
Data2 = rnorm(n))
########
###ggplot2 graph template#####
TestGPlot <- ggplot(TestData, aes(x = Group, y = Data1,
color = Group, group = Group))
########
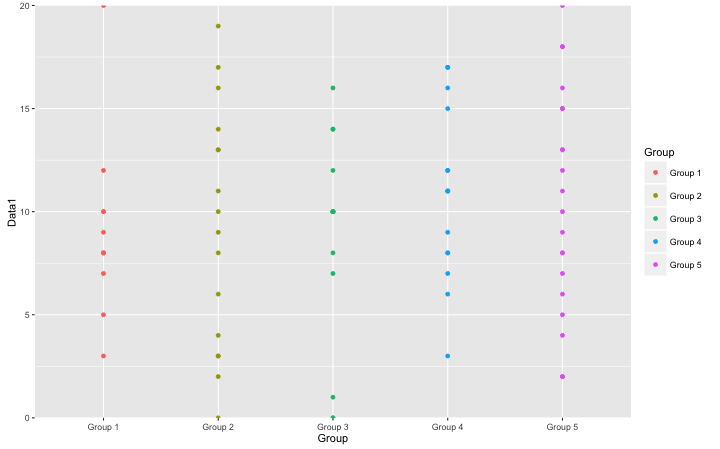
###Basic Scatter Plot#####
TestGPlot + geom_point()
########
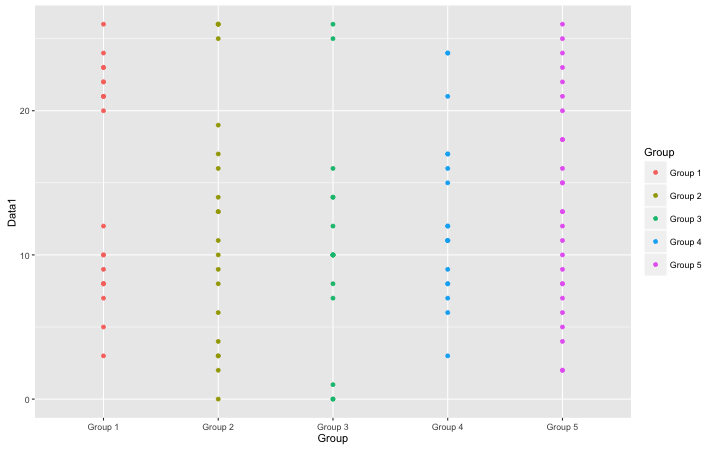
#Set the maximum value of the axis:axis0 command
#Maximum value setting:max option
#Set value properties:continuous,deiscrete
#Axis of symmetry:axis option
TestGPlot +
geom_point() +
axis0(max = 20, scale = "continuous", axis = "y")
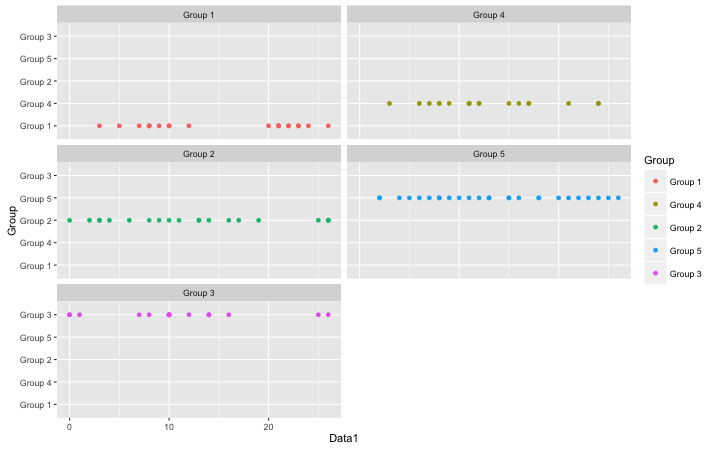
#Plot placement in line direction when using
#the facet_wrap command:fill_by_column command
#Specify split data:fact option
ggplot(fill_by_column(TestData, fact = "Group"),
aes(x = Group, y = Data1, color = Group)) +
geom_point() + facet_wrap(~Group, ncol = 2) +
coord_flip()
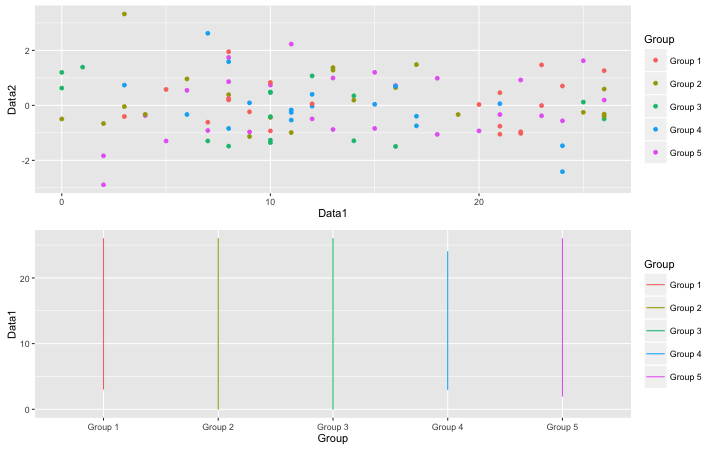
#Display two plots side by side:ggalign command
#Exsample Scatter Plot
PointPlot <- TestGPlot + geom_point(aes(x = Data1, y = Data2)) + labs(x = "Data1", y = "Data2")
#Exsample Line Plot
LinePlot <- TestGPlot + geom_line()
#Plot
ggalign(plot1 = PointPlot, plot2 = LinePlot)
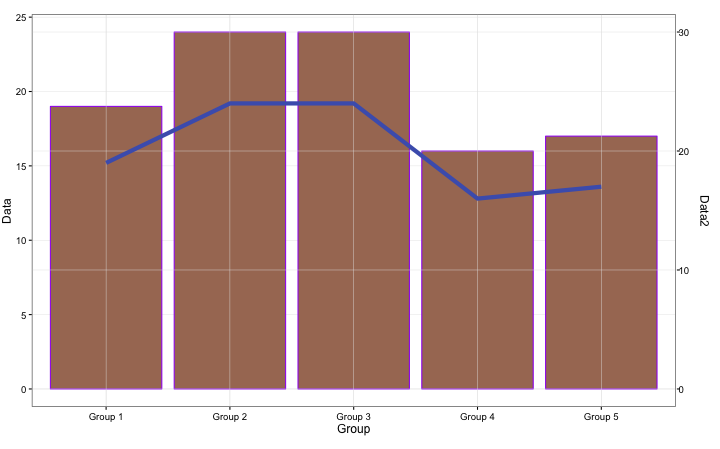
#Plotted on 2 axes:ggdual_axis command
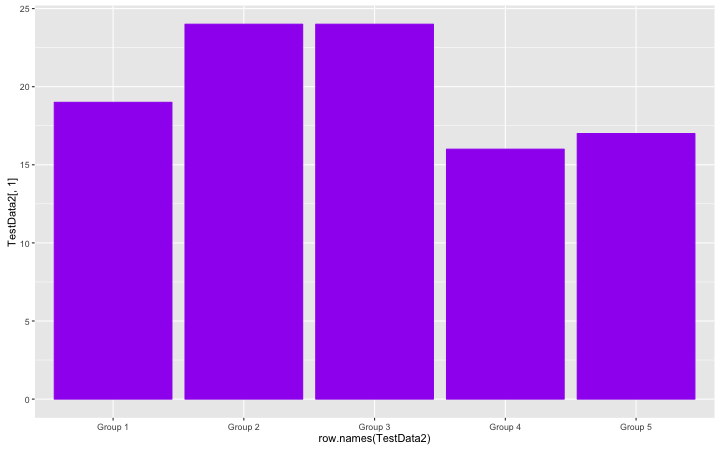
#Creating Data
TestData2 <- as.data.frame(tapply(TestData$Group, TestData$Group, length))
TwoGGPlot <- ggplot(TestData2, aes(x = row.names(TestData2), y = TestData2[, 1]))
#Bar Plot
LinePlot <- TwoGGPlot + geom_bar(stat = "identity", fill = "#a87963") + theme_bw() +
theme(plot.margin = grid::unit(c(.5, 1, .5, 0), "cm")) +
labs(x = "Group", y = "Data")
#Line Plot
LinePlot2 <- TwoGGPlot + geom_line(group = 1, color = "#4b61ba", size = 2) + theme_bw() +
theme(plot.margin = grid::unit(c(.5, 1, .5, 0), "cm")) + ylim(0, 30) +
labs(x = "Group", y = "Data2")
#Plot
ggdual_axis(lhs = LinePlot, rhs = LinePlot2)
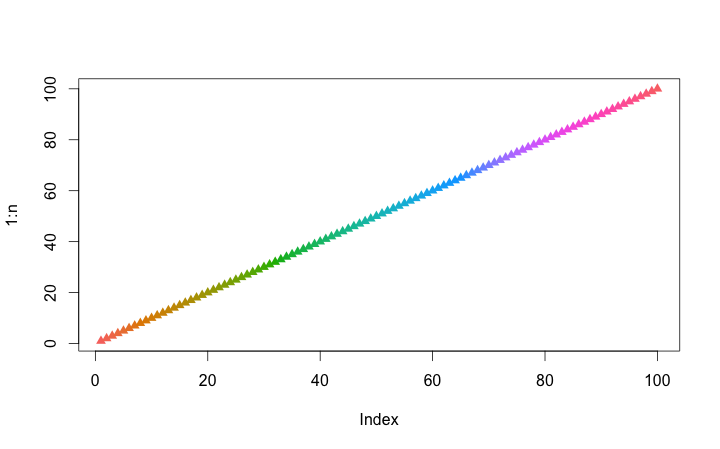
#Get Gradient:ggcolors command
#Gradient range:n option
n <- 10
GGCols <- ggcolors(n)
plot(1:n, pch = 17, col = GGCols)
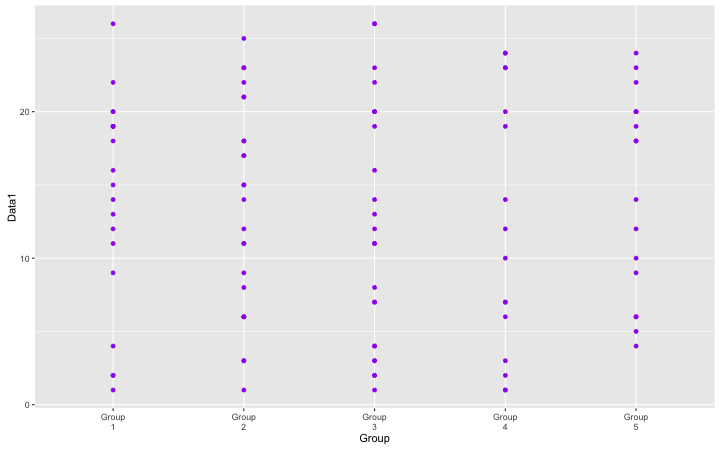
#Display labels on a new line with a blank space:label_breaks command
#Specify target columns:split.col option
ggplot(label_breaks(TestData, split.col = 1), aes(x = Group, y = Data1)) +
geom_point()
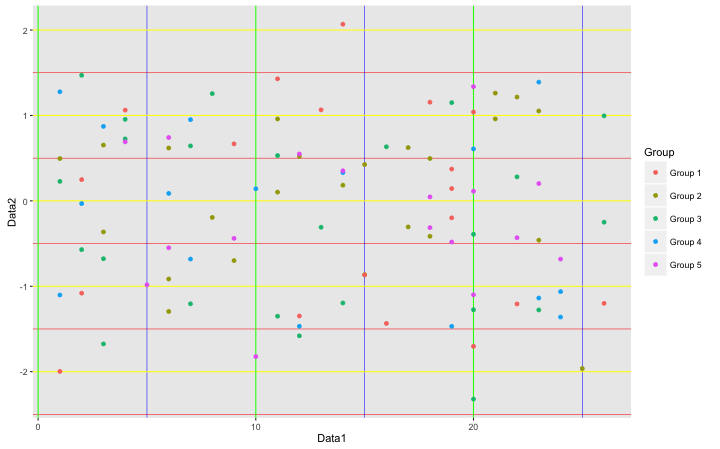
#Adjustment of grid lines:qgrid command
#Batch adjustment:x,y option;NULL to hide
TestGPlot +
geom_point(aes(x = Data1, y = Data2)) + labs(x = "Data1", y = "Data2") +
qgrid(#x = NULL, y = NULL,
xmaj = "green", xmin = "blue", ymaj = "yellow", ymin = "red")
#Calculate maximum value, etc.:cushion command
#For categorical data, the most common number is the maximum value.
#Data:x option
#Specify coefficients:pad option
#For categorical data
#Example of frequency calculation
#tapply(TestData$Group, TestData$Group, length)
#Group1 Group2 Group3 Group4 Group5
#  18 23 21 20 18
#cushion command,Result "23 + 23*pad"=46
cushion(TestData$Group, pad = 1)
[1] 46Output Example
・Basic Scatter Plot
・axis0 command
・fill_by_column command
・ggalign command
・ggdual_axis command
・ggcolors command
・ggplot_col command
・label_breaks command
・qgrid command
I hope this makes your analysis a little easier !!