Rで解析:表を作るのに困ったら「gt」パッケージ

Rの解析に役に立つ記事
スポンサーリンク

表を作るコマンドが一通り収録されているパッケージの紹介です。表内の文字やセルの体裁を整えることはもちろん、HTML、PDF、PNG、LaTeX、RTF形式での出力、データの分割、表にggplotオブジェクトを埋め込むコマンドなどが収録されています。多くのコマンドが収録されています。興味があればパッケージヘルプを確認してください。

パッケージバージョンは0.4.0。実行コマンドはwindows 11のR version 4.1.2で確認しています。

スポンサーリンク

パッケージのインストール

下記、コマンドを実行してください。また、PDF、PNG形式での出力に必要な「webshot」パッケージのinstall_phantomjsコマンドを実行し「phantomjs」をインストールます。

#パッケージのインストール
install.packages("gt")
#webshotパッケージがなければインストール
install.packages("webshot")
#webshot::install_phantomjs()コマンドを実行
webshot::install_phantomjs(force = TRUE)

実行コマンド

詳細はコメント、パッケージのヘルプを確認してください。

#パッケージの読み込み
library("gt")

###データ例の作成#####
#tidyverseパッケージがなければインストール
if(!require("tidyverse", quietly = TRUE)){
  install.packages("tidyverse");require("tidyverse")
}
set.seed(1234)
n <- 10
TestData <- tibble(Group = sample(paste0("Group", 1:4), n,
                                  replace = TRUE),
                   Num_Data = sample(c(1:50), n, replace = TRUE),
                   Currency = sample(c(1000:10000), n, replace = TRUE),
                   Fct_Data_1 = factor(sample(c("&#12363;", "&#12425;", "&#12384;", "&#12395;",
                                                "&#12356;", "&#12356;", "&#12418;", "&#12398;"),
                                              n, replace = TRUE)),
                   Chr_Data = sample(c("&#12363;", "&#12425;", "&#12384;", "&#12395;",
                                       "&#12356;", "&#12356;", "&#12418;", "&#12398;"),
                                     n, replace = TRUE),
                   Fct_Data_2 = factor(sample(c("&#12363;", "&#12425;", "&#12384;", "&#12395;",
                                                "&#12356;", "&#12356;", "&#12418;", "&#12398;"),
                                              n, replace = TRUE)))
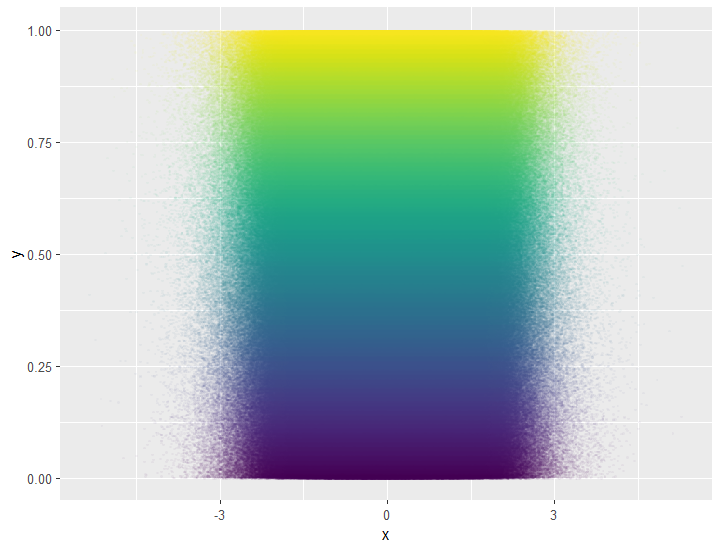
#ggplot&#12458;&#12502;&#12472;&#12455;&#12463;&#12488;&#12434;&#20316;&#25104;
plot_object <- ggplot(TestData, aes(x = Num_Data)) +
  geom_bar(color = "blue") +
  theme(legend.position = "none")
########


###&#22522;&#26412;&#30340;&#12394;&#12467;&#12510;&#12531;&#12489;#####
#&#34920;&#12398;&#22522;&#30990;&#12392;&#12394;&#12427;gt&#12458;&#12502;&#12472;&#12455;&#12463;&#12488;&#12434;&#20316;&#25104;:gt&#12467;&#12510;&#12531;&#12489;
#&#34920;&#12434;&#25351;&#23450;&#12464;&#12523;&#12540;&#12503;&#12391;&#20998;&#21106;:groupname_col&#12458;&#12503;&#12471;&#12519;&#12531;;
#&#21021;&#26399;&#20516;:dplyr::group_vars(data)
#&#34892;&#21517;&#12487;&#12540;&#12479;&#12434;&#25351;&#23450;:rowname_col&#12458;&#12503;&#12471;&#12519;&#12531;;&#21021;&#26399;&#20516;:"rowname"
#&#20182;&#12458;&#12503;&#12471;&#12519;&#12531;&#12399;&#12504;&#12523;&#12503;&#21442;&#29031;
TestData %>% 
  gt(groupname_col = "Chr",
       rowname_col = "Group")

#&#34920;&#12434;&#20445;&#23384;:gtsave&#12467;&#12510;&#12531;&#12489;
#&#20445;&#23384;&#24418;&#24335;:HTML,PDF,PNG,LaTeX,RTF&#12364;&#23550;&#24540;
#&#23455;&#26045;&#12456;&#12521;&#12540;&#12398;&#22580;&#21512;&#12399;webshot::install_phantomjs()&#12467;&#12510;&#12531;&#12489;&#12434;&#23455;&#34892;
TestData %>% 
  gt(groupname_col = "Chr",
     rowname_col = "Group") %>%
  gtsave("Test.png", path = NULL)
########


###&#34920;&#12398;&#20307;&#35009;&#12467;&#12510;&#12531;&#12489;#####
#&#27969;&#12428;&#12391;&#35500;&#26126;
TestData %>% 
  gt() %>%
  #&#34920;&#12434;&#25351;&#23450;&#12464;&#12523;&#12540;&#12503;&#12391;&#20998;&#21106;:tab_row_group&#12467;&#12510;&#12531;&#12489;
  #&#12521;&#12505;&#12523;&#12434;&#25351;&#23450;:label&#12458;&#12503;&#12471;&#12519;&#12531;
  #&#22522;&#28310;&#12434;&#25351;&#23450;:rows&#12458;&#12503;&#12471;&#12519;&#12531;;&#27491;&#35215;&#34920;&#29694;&#12418;&#35373;&#23450;&#21487;&#33021;
  tab_row_group(label = "Num_Data >= 25",
                rows = Num_Data >= 25) %>%
  tab_row_group(label = "Fct_Data&#12364;&#12300;&#12395;&#12301;",
                rows = Fct_Data_1 == "&#12395;") %>%
  
  #&#12504;&#12483;&#12480;&#12540;&#12434;&#32232;&#38598;:tab_header&#12467;&#12510;&#12531;&#12489;
  tab_header(title = "KARADA TITLE",
             subtitle = "&#12363;&#12425;&#12384; &#12356;&#12356;&#12418;&#12398;") %>%
  
  #&#12501;&#12483;&#12479;&#12540;&#20596;&#12395;&#12494;&#12540;&#12488;&#12434;&#35352;&#36848;:tab_source_note&#12467;&#12510;&#12531;&#12489;
  #&#12494;&#12540;&#12488;&#20869;&#23481;:source_note&#12458;&#12503;&#12471;&#12519;&#12531;
  tab_source_note(source_note = "*KARADA-&#12356;&#12356;&#12418;&#12398;") %>%
  
  #&#25351;&#23450;&#25991;&#23383;&#12391;&#21015;&#21517;&#12434;&#20998;&#21106;&#12375;&#21015;&#12521;&#12505;&#12523;,&#12487;&#12540;&#12479;&#12521;&#12505;&#12523;&#34920;&#31034;&#12395;&#12377;&#12427;:
  #tab_spanner_delim&#12467;&#12510;&#12531;&#12489;
  #&#20998;&#21106;&#25991;&#23383;:delim&#12458;&#12503;&#12471;&#12519;&#12531;
  #&#21306;&#20999;&#12426;&#20301;&#32622;:spilit&#12458;&#12503;&#12471;&#12519;&#12531;;"last"/"first"
  #&#21015;&#12434;&#25351;&#23450;:columns&#12458;&#12503;&#12471;&#12519;&#12531;;&#21021;&#26399;&#20516;:everything()
  tab_spanner_delim(delim = "_",
                    split = "last",
                    columns = c(Fct_Data_1, Fct_Data_2)) %>%
  
  #&#21015;&#12521;&#12505;&#12523;&#12434;&#36861;&#21152;:tab_spanner&#12467;&#12510;&#12531;&#12489;
  tab_spanner(label = "&#12402;&#12425;&#12364;&#12394;_&#25968;&#23383;",
              columns = c(Chr_Data, Currency)) %>%
  #&#21015;&#12469;&#12502;&#12479;&#12452;&#12488;&#12523;&#12434;&#36861;&#21152;:tab_stubhead&#12467;&#12510;&#12531;&#12489;
  #tab_row_group&#12467;&#12510;&#12531;&#12489;&#12392;&#21516;&#26178;&#19981;&#21487;
  #tab_stubhead(label = "&#12390;&#12377;&#12392;") %>%
  #########
  
#&#21508;&#12475;&#12523;&#12398;&#26360;&#24335;&#12434;&#35373;&#23450;:tab_style&#12467;&#12510;&#12531;&#12489;
  #&#26360;&#24335;&#12434;&#35373;&#23450;:style&#12458;&#12503;&#12471;&#12519;&#12531;
  #&#21508;&#35373;&#23450;&#12399;list&#12414;&#12383;&#12399;cell_XXX&#12467;&#12510;&#12531;&#12489;&#12391;&#35352;&#36848;
  #&#36969;&#24540;&#26465;&#20214;&#12434;&#25351;&#23450;:locations&#12458;&#12503;&#12471;&#12519;&#12531;
  #&#21508;&#35373;&#23450;&#12399;list&#12414;&#12383;&#12399;cells_XXX&#12467;&#12510;&#12531;&#12489;&#12391;&#35352;&#36848;
  tab_style(
    #&#26360;&#24335;&#12434;&#35373;&#23450;
    style =
      list(
      #&#22615;&#12426;&#33394;&#35373;&#23450;:cell_fill&#12467;&#12510;&#12531;&#12489;
      #&#12450;&#12523;&#12501;&#12449;&#20516;:alpha&#12458;&#12503;&#12471;&#12519;&#12531;;0:1
      cell_fill(color = "lightcyan", alpha = NULL),
      
      #&#12486;&#12461;&#12473;&#12488;&#35373;&#23450;:cell_text&#12467;&#12510;&#12531;&#12489;
      #&#33394;:color&#12458;&#12503;&#12471;&#12519;&#12531;
      #&#12469;&#12452;&#12474;:size&#12458;&#12503;&#12471;&#12519;&#12531;;"xx-small","x-small","small",
      #"medium","large","x-large","xx-large"
      #&#27700;&#24179;&#20301;&#32622;:align&#12458;&#12503;&#12471;&#12519;&#12531;;"center","left","right","justify"
      #&#22402;&#30452;&#20301;&#32622;:v_align&#12458;&#12503;&#12471;&#12519;&#12531;;"middle","top","bottom"
      #&#12501;&#12457;&#12531;&#12488;&#12473;&#12479;&#12452;&#12523;:style&#12458;&#12503;&#12471;&#12519;&#12531;;"normal","italic","oblique"
      #&#12501;&#12457;&#12531;&#12488;&#12454;&#12455;&#12452;&#12488;:weight&#12458;&#12503;&#12471;&#12519;&#12531;;"normal","bold","lighter",
      #"bolder"&#12414;&#12383;&#12399;1:1000&#12398;&#25968;&#23383;
      #&#19978;&#20184;&#12365;,&#19979;&#20184;&#12365;&#12398;&#35373;&#23450;:transform&#12458;&#12503;&#12471;&#12519;&#12531;;
      #"uppercase","lowercase","capitalize"
      #&#12507;&#12527;&#12452;&#12488;&#12473;&#12506;&#12540;&#12473;:whitespace&#12458;&#12503;&#12471;&#12519;&#12531;;
      #"normal","nowrap","pre","pre-wrap","pre-line","break-spaces"
      #&#12452;&#12531;&#12487;&#12531;&#12488;:indent&#12458;&#12503;&#12471;&#12519;&#12531;;&#12500;&#12463;&#12475;&#12523;&#20516;
      cell_text(weight = "bold", align = "center", v_align = "middle"),
      
      #&#26528;&#32218;&#35373;&#23450;:cell_borders&#12467;&#12510;&#12531;&#12489;
      #&#20301;&#32622;:side&#12458;&#12503;&#12471;&#12519;&#12531;;""all,"left","right","top","bottom"
      #&#32218;&#31278;:style&#12458;&#12503;&#12471;&#12519;&#12531;;solid,"dashed","dotted"
      cell_borders(sides = "all", color = "red",
                   style = "dashed", weight = px(2))
      ),
      
      #&#36969;&#24540;&#26465;&#20214;&#12434;&#25351;&#23450;
      locations = cells_body(columns = Num_Data,
                             rows = Num_Data >= 20)) %>%
  
  #&#21508;&#12475;&#12523;&#12398;&#26360;&#24335;&#12434;&#35373;&#23450;
  tab_style(
    style = list(cell_fill(color = "#92C2FF")),
    locations = cells_body(columns = "Chr_Data",
                           rows = c(1, 5, 10))) %>%
  
  #&#25968;&#20516;&#12434;&#36890;&#36008;&#34920;&#31034;&#12395;&#12377;&#12427;:fmt_currency&#12467;&#12510;&#12531;&#12489;
  #&#36890;&#36008;&#12434;&#25351;&#23450;:currency&#12458;&#12503;&#12471;&#12519;&#12531;;"USD","pound","yen","EUR"&#12394;&#12393;
  #&#20182;&#12399;info_currencies()&#12434;&#23455;&#34892;&#12377;&#12427;&#12392;Viewer&#12391;&#34920;&#31034;&#12373;&#12428;&#12414;&#12377;
  #&#23550;&#35937;&#21015;&#12434;&#25351;&#23450;:columns&#12458;&#12503;&#12471;&#12519;&#12531;
  #&#23567;&#25968;&#28857;&#12398;&#34920;&#31034;:decimals&#12458;&#12503;&#12471;&#12519;&#12531;
  fmt_currency(columns = Currency,
               currency = "yen",
               decimals = 0) %>%
  
  #&#25968;&#20516;&#12434;&#12497;&#12540;&#12475;&#12531;&#12488;&#12395;&#12377;&#12427;:fmt_currency&#12467;&#12510;&#12531;&#12489;
  fmt_percent(columns = Num_Data, 
              decimals = 0) %>%
  
  #&#12464;&#12523;&#12540;&#12503;&#12398;&#38918;&#30058;&#12434;&#20837;&#12428;&#26367;&#12360;:row_group_order&#12467;&#12510;&#12531;&#12489;
  #&#12464;&#12523;&#12540;&#12503;&#21517;&#12364;&#20184;&#12356;&#12390;&#12394;&#12356;&#12464;&#12523;&#12540;&#12503;&#12399;NA&#12391;&#25351;&#23450;
  row_group_order(groups = c("Num_Data >= 25", NA)) %>%
  
  #ggplot&#12458;&#12502;&#12472;&#12455;&#12463;&#12488;&#12434;&#25407;&#20837;:text_transform,ggplot_image&#12467;&#12510;&#12531;&#12489;&#12434;&#32068;&#12415;&#21512;&#12431;&#12379;&#12427;
  text_transform(locations = cells_body(columns = Num_Data, rows = 2),
                 fn = function(x) {
                   plot_object %>%
                     ggplot_image(height = px(200))}) %>%
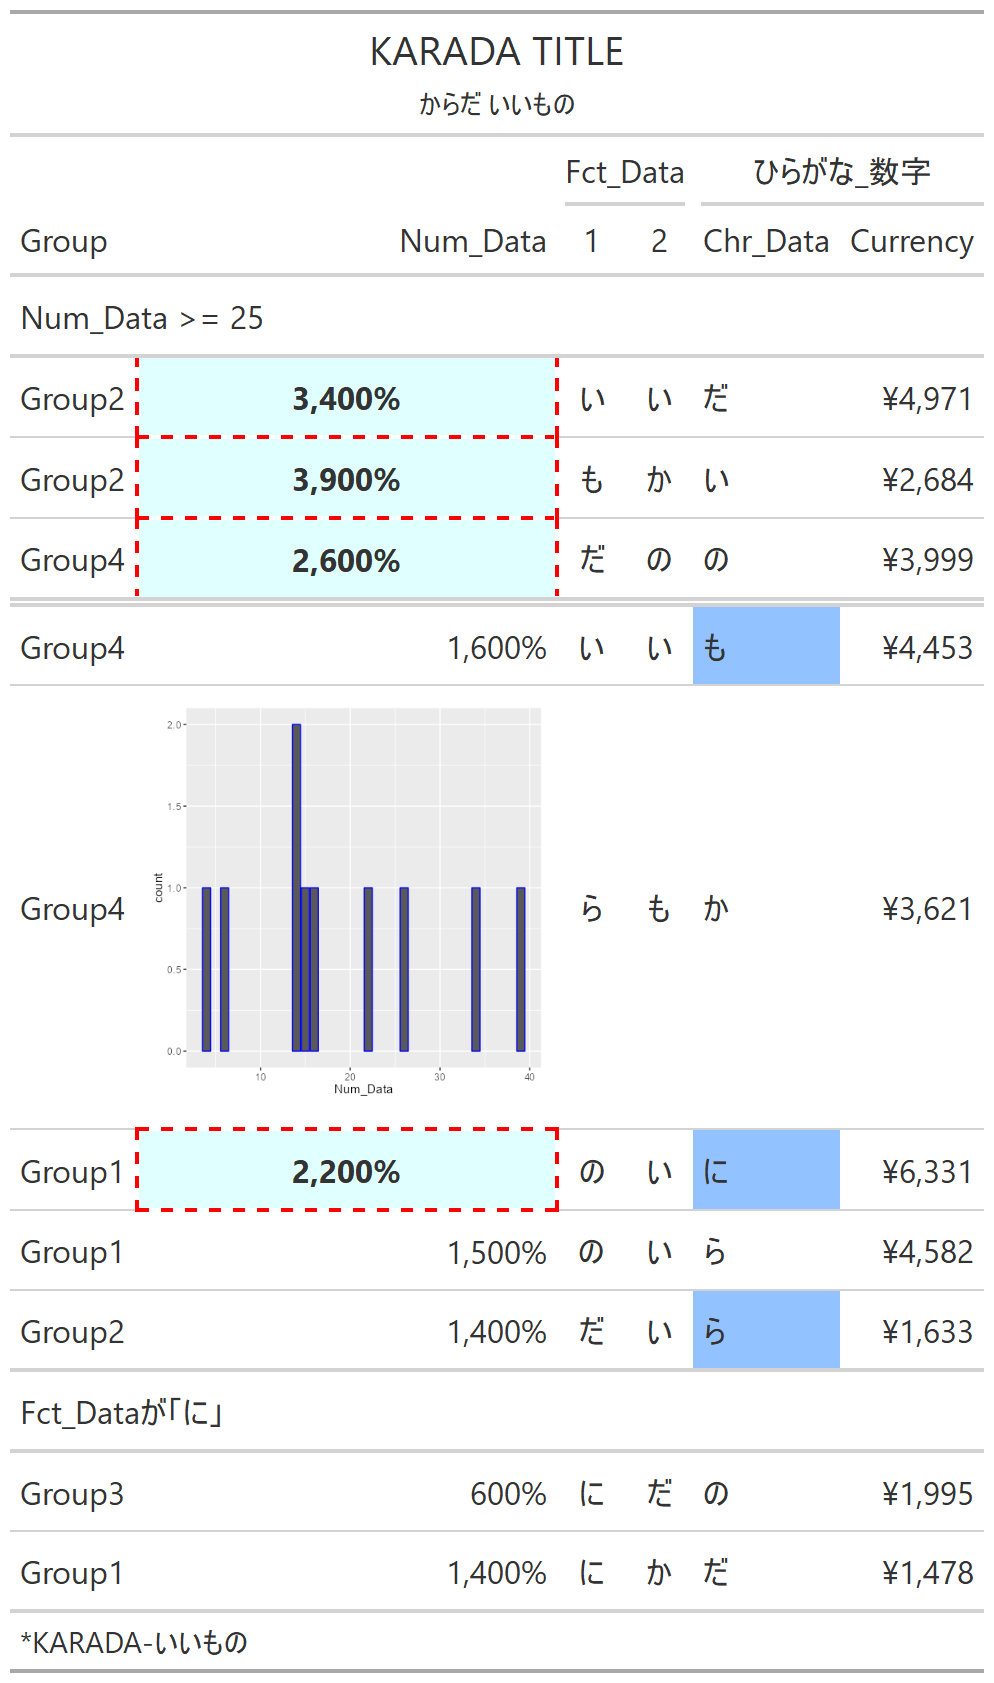
  
  #&#20316;&#26989;&#12501;&#12457;&#12523;&#12480;&#12395;&#20445;&#23384;
  gtsave("Test.png", path = NULL)

出力例


少しでも、あなたの解析が楽になりますように!!

タイトルとURLをコピーしました