フォレストプロットの体裁が簡単にできるパッケージの紹介です。パッケージ利用のカギになるのはコマンドに適応したデータの作成でしょうか。紹介では2グループの信頼区間を表示するフォレストプロットを作成しています。実行コマンド内の「データ例の作成」を確認いただければコツを理解できると思います。
パッケージバージョンは0.1.2。実行コマンドはwindows 11のR version 4.1.2で確認しています。
パッケージのインストール
下記、コマンドを実行してください。
#パッケージのインストール
install.packages("forestploter")
実行コマンド
詳細はコメント、パッケージのヘルプを確認してください。
#必要パッケージの読み込み
library("forestploter")
###データ例の作成#####
#tidyverseパッケージがなければインストール
if(!require("tidyverse", quietly = TRUE)){
install.packages("tidyverse");require("tidyverse")
}
TestData <- tibble(SubGroup = c("ALL", "System", "PC", "MOBILE",
"SEX", "Male", "Female"),
General = c(400, "", 150, 250, "", 150, 250),
Engineer = c(450, "", 300, 150, "", 150, 300),
HR_1 = c(1.125, NA, 2.00, 0.6, NA, 1.00, 1.2),
HR_2 = c(0.825, NA, 1.50, 0.3, NA, 0.85, 1.2),
Lower_1 = c(0.951, NA, 1.235, 0.523, NA, 0.547, 0.658),
Lower_2 = c(0.651, NA, 1.435, 0.223, NA, 0.447, 1.158),
Upper_1 = c(1.183, NA, 2.235, 0.723, NA, 1.147, 1.358),
Upper_2 = c(0.853, NA, 1.735, 0.523, NA, 1.047, 1.358),
Se_1 = c(0.193, NA, 0.235, 0.023, NA, 0.147, 0.358),
Se_2 = c(0.083, NA, 0.135, 0.003, NA, 0.047, 0.258)) %>%
#グループ名以外は「インデント」を挿入する処理
mutate(SubGroup = ifelse("" == General, SubGroup,
paste0(" ", SubGroup))) %>%
#グラフを正しい位置に表示するための調整列
mutate(" " = paste(rep(" ", 20), collapse = " ")) %>%
#HR (95% CI)_1の情報
mutate("HR (95% CI)_1" = ifelse(is.na(HR_1), "",
paste0(HR_1, " (", Lower_1, " to ", Upper_1, ")"))) %>%
#HR (95% CI)_2の情報
mutate("HR (95% CI)_2" = ifelse(is.na(HR_2), "",
paste0(HR_2, " (", Lower_2, " to ", Upper_2, ")")))
########
#フォレストプロットのテーマ作成:forest_themeコマンド
#その他オプションはヘルプ参照
tm <- forest_theme(base_size = 10, #テキストサイズ
refline_lty = "solid", #リファレンスライン線種
refline_col = "red", #リファレンスライン色
ci_pch = c(15, 18), #点推定値シンボル種類
ci_col = c("#377eb8", "#4daf4a"), #信頼区間のひげ色
ci_lty = c(1, 2), #信頼区間のひげ線種
footnote_col = "blue", #フットノート色
legend_name = "Group", #凡例名
legend_value = c("KARADA_1", "KARADA_2"), #グループ名
vertline_lty = c("dashed", "dotted"), #垂直線種
vertline_col = c("#d6604d", "blue") #垂直線種
)
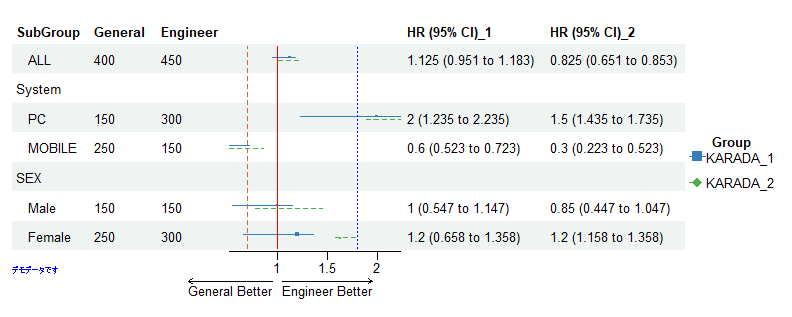
#フォレストプロットの作成:forestコマンド
#プロットデータが複数の場合はlist形式にする
ForestPlot <- forest(TestData[,c(1:3, 12:14)],
est = list(TestData$HR_1,
TestData$HR_2),
lower = list(TestData$Lower_1,
TestData$Lower_2),
upper = list(TestData$Upper_1,
TestData$Upper_2),
sizes = list(TestData$Se_1,
TestData$Se_2),
ci_column = 4, #プロットを挿入する列の位置
ref_line = 1, #リファレンスラインの基準
vert_line = c(0.7, 1.8), #垂直線の追加
arrow_lab = c("General Better",
"Engineer Better"),
footnote = "デモデータです",
theme = tm)
#プロット
plot(ForestPlot)
#フォレストプロット体裁の調整:edit_plotコマンド
###gridパッケージが必要です#####
#gridパッケージがなければインストール
if(!require("grid", quietly = TRUE)){
install.packages("grid");require("grid")
}
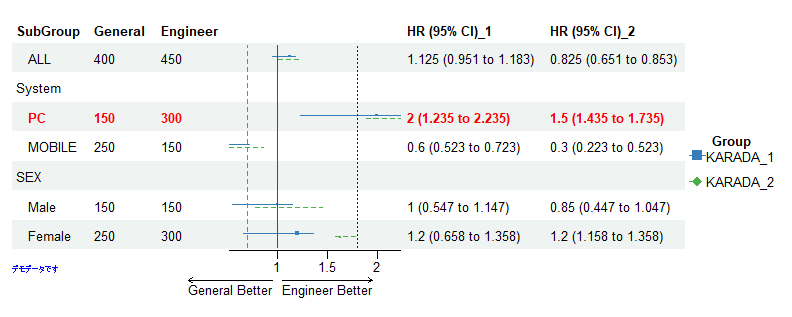
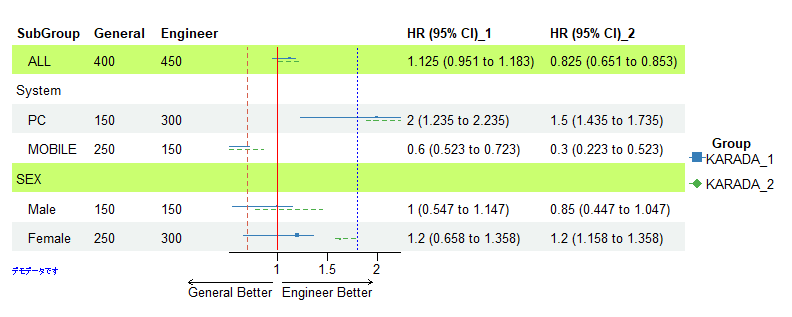
#文字を赤色,太字にする:edit_plotコマンド
ColChange <- edit_plot(ForestPlot,
row = 3, #行の選択
gp = gpar(col = "red",
fontface = "bold"))
plot(ColChange)
#背景を塗りつぶす:edit_plotコマンド
#whichオプション:"background"を指定
FillChange <- edit_plot(ForestPlot, row = c(1, 5), which = "background",
gp = gpar(fill = "darkolivegreen1"))
plot(FillChange)
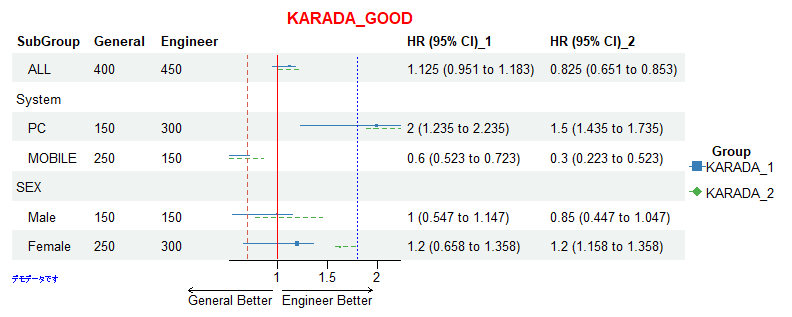
#ヘッダーに文字を挿入:insert_textコマンド
#partオプション;"header"を指定
InsertHeader <- insert_text(ForestPlot,
text = "KARADA_GOOD",
col = 3:5, #挿入位置
part = "header",
gp = gpar(col = "red",
fontface = "bold"))
plot(InsertHeader)
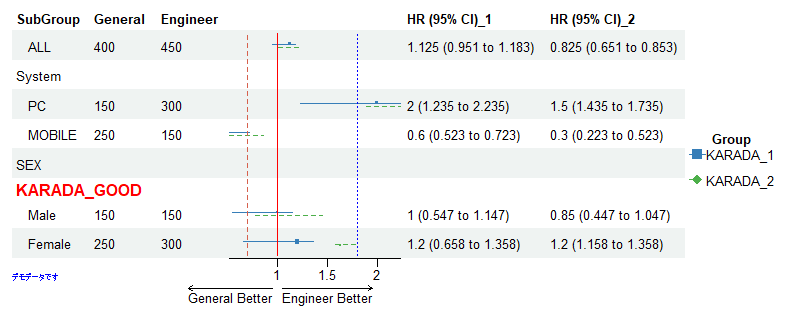
#指定した行に文字を挿入:insert_textコマンド
#partオプション;"body"を指定
InsertBody <- insert_text(ForestPlot,
text = "KARADA_GOOD",
row = 6, #挿入列位置
just = "left", #文字の位置;"center","left","right"
gp = gpar(col = "red",
fontface = "bold"))
plot(InsertBody)出力例
・フォレストプロットの作成:forestコマンド
・文字を赤色,太字にする:edit_plotコマンド
・背景を塗りつぶす:edit_plotコマンド
・ヘッダーに文字を挿入:insert_textコマンド
・partオプション;”body”を指定
少しでも、あなたの解析が楽になりますように!!