Rで解析:ワッフル図が簡単です「baffle」パッケージ

Rの解析に役に立つ記事
スポンサーリンク

ワッフル図を簡単に作成できるパッケージの紹介です。シンボルをテキストに変換しプロットできます。

パッケージバージョンは0.2.1。実行コマンドはwindows 11のR version 4.2.1で確認しています。

スポンサーリンク

パッケージのインストール

下記コマンドを実行してください。

#パッケージのインストール
install.packages("baffle")

実行コマンドの紹介

詳細はコマンド、各パッケージのヘルプを確認してください。

#パッケージの読み込み
library("baffle")

###データ例の作成#####
set.seed(1234)
TestData <- table(sample(LETTERS[1:3], 50, replace = TRUE))
########

#&#12527;&#12483;&#12501;&#12523;&#12503;&#12525;&#12483;&#12488;&#12398;&#20316;&#25104;:waffle&#12467;&#12510;&#12531;&#12489;
#&#21015;&#26041;&#21521;&#12398;&#12503;&#12525;&#12483;&#12488;&#25968;&#12434;&#25351;&#23450;:nrow&#12458;&#12503;&#12471;&#12519;&#12531;
#&#34892;&#26041;&#21521;&#12398;&#12503;&#12525;&#12483;&#12488;&#25968;&#12434;&#25351;&#23450;:ncol&#12458;&#12503;&#12471;&#12519;&#12531;
#&#12503;&#12525;&#12483;&#12488;&#21015;&#34892;&#21521;&#12365;&#12434;&#25351;&#23450;:byrow&#12458;&#12503;&#12471;&#12519;&#12531;
#&#12503;&#12525;&#12483;&#12488;&#38283;&#22987;&#20301;&#32622;&#12434;&#25351;&#23450;:from&#12458;&#12503;&#12471;&#12519;&#12531;;
#"bottomleft","bottomright","topleft","topright"&#12364;&#21487;&#33021;
#&#12471;&#12531;&#12508;&#12523;&#12398;&#35373;&#23450;:f&#12458;&#12503;&#12471;&#12519;&#12531;;square,circle,rcpoly&#12364;&#21487;&#33021;
#&#12471;&#12531;&#12508;&#12523;&#12398;&#31309;&#12415;&#19978;&#12370;&#35373;&#23450;:stacked&#12458;&#12503;&#12471;&#12519;&#12531;
#rcpoly&#35373;&#23450;&#26178;&#12398;&#38914;&#28857;&#25968;&#12434;&#25351;&#23450;:n&#12458;&#12503;&#12471;&#12519;&#12531;
#&#22615;&#33394;&#12398;&#25351;&#23450;:col&#12458;&#12503;&#12471;&#12519;&#12531;
waffle(TestData,
       nrow = 6, ncol = NULL,
       byrow = FALSE, from = "bottomleft",
       stacked = FALSE, gap = 1,
       f = rcpoly, n = c(3, 6, 5),
       col = palette.colors(3, "Set 2"))

#&#20961;&#20363;&#12398;&#36861;&#21152;:graphics::legend&#12434;&#20351;&#12358;
legend(x = "top", horiz = TRUE, border = NA,
       inset = 1, xpd = TRUE, bty = "n",
       legend = names(TestData), cex = 1.3,
       fill = palette.colors(3, "Set 2"),
       title = "&#12479;&#12452;&#12488;&#12523;&#12486;&#12473;&#12488;")

###&#25991;&#23383;&#12391;&#12527;&#12483;&#12501;&#12523;&#12503;&#12525;&#12483;&#12488;#####
#&#19979;&#35352;&#12458;&#12501;&#12451;&#12471;&#12515;&#12523;&#12469;&#12452;&#12488;&#12363;&#12425;&#24341;&#29992;
#https://j-moravec.github.io/baffle/articles/baffle.html#text-and-points
#&#25991;&#23383;&#12469;&#12452;&#12474;&#12392;&#12486;&#12461;&#12473;&#12488;&#20869;&#23481;&#12434;&#35336;&#31639;&#12377;&#12427;
autotext <- function(x, y, labels, d=0.9, ...){
  cex = min(1/strheight(labels), 1/strwidth(labels))*d
  text(x, y, labels, cex=cex, ...)
}
#waffle&#12467;&#12510;&#12531;&#12489;&#12395;&#36969;&#24540;
#f&#12458;&#12503;&#12471;&#12519;&#12531;&#12395;autotext&#12434;&#36969;&#24540;
#labels&#12458;&#12503;&#12471;&#12519;&#12531;&#12395;&#25991;&#23383;&#21015;&#12434;&#25351;&#23450;
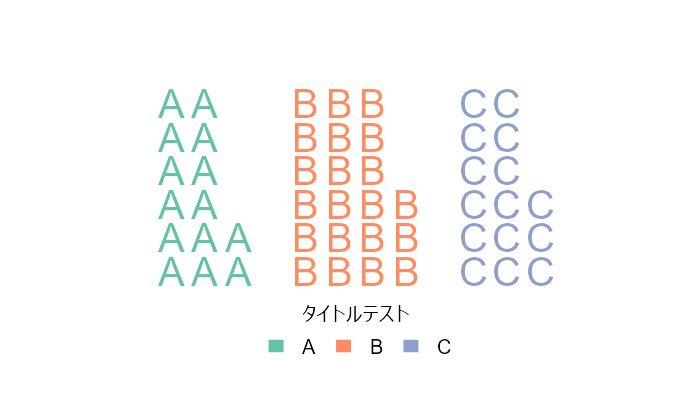
waffle(TestData,
       nrow = 6, ncol = NULL,
       byrow = FALSE, from = "bottomleft",
       stacked = FALSE, gap = 1,
       f = autotext, labels = names(TestData),
       col = palette.colors(3, "Set 2"))
#&#20961;&#20363;&#12398;&#36861;&#21152;:graphics::legend&#12434;&#20351;&#12358;
legend(x = "top", horiz = TRUE, border = NA,
       inset = 1, xpd = TRUE, bty = "n",
       legend = names(TestData), cex = 1.3,
       fill = palette.colors(3, "Set 2"),
       title = "&#12479;&#12452;&#12488;&#12523;&#12486;&#12473;&#12488;")
########

出力例

・waffleコマンド

・文字でワッフルプロット


少しでも、あなたの解析が楽になりますように!!

タイトルとURLをコピーしました