アメリカ海洋大気庁(National Oceanic and Atmospheric Administration:NOAA)から深度データを取得しプロットできるパッケージの紹介です。プロットの基本はbase::plotなのでプロットの装飾に使うコマンドは共通です。そのため、幅広い装飾が可能です。
CRANのパッケージページのVignettesに解析例が紹介されています。非常に参考になるので確認をおすすめします。
https://cran.r-project.org/web/packages/marmap/index.html
パッケージバージョンは1.0.9。R version 4.2.2で確認しています。
パッケージのインストール
下記コマンドを実行してください。
#パッケージのインストール
install.packages("marmap")
実行コマンド
詳細はコマンド、パッケージのヘルプを確認してください。
#パッケージの読み込み
library("marmap")
#NOAAサーバーから深度データを取得しbathy class作成:getNOAA.bathyコマンド
#座標範囲の指定:経度:lon1,lon2;緯度:lat1,lat2オプション;
#同じ座標範囲の場合は実行済みのデータを読み込みます
#解像度の設定:resolutionオプション;初期値:4
#作業フォルダに取得深度データをcsvで保存:keepオプション;TRUE/FALSE
#反太平洋子午線のデータを取得:antimeridianオプション;keep=TRUEが推奨;TRUE/FALSE
TestBathy <- getNOAA.bathy(lon1 = 138, lon2 = 148,
lat1 = 41, lat2 = 46,
resolution = 4, keep = TRUE,
antimeridian = FALSE)
#bathy classをプロット:plot.bathyコマンド
#「plot」で使用が可能
#bathy classを指定:xオプション
#深度の色の有無:imageオプション;初期値:FALSE/TRUE
#image=TRUEの場合に使用する色:bpalオプション;初期値:NULL(青色)
#bathy classに含まれる地形データの利用:landオプション:TRUE/FALSE
#等深線間隔の設定:nオプション
#等深線の太さ/線種/色:lwd/lty/colオプション
#等深線ラベル:drawlabelsオプション
#X軸/Y軸のラベル:xlab/ylabオプション
#X/Yのアスペクト比:aspオプション
#「base::plot」のオプションが設定可能
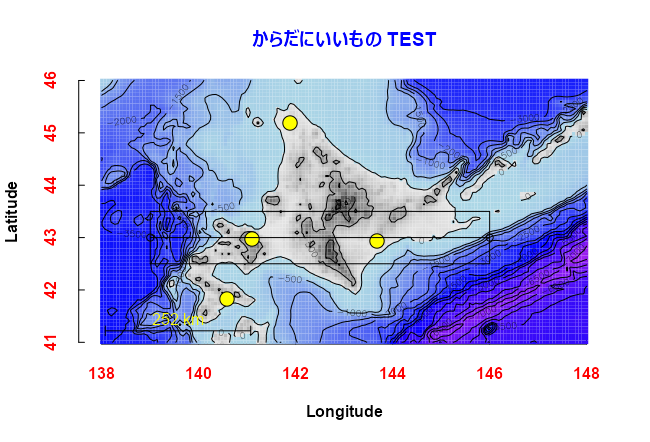
plot(x = TestBathy, image = TRUE,
#helpより[深さ制限のあるパレット]作成例
bpal = list(c(min(TestBathy), 0, "purple", "blue", "lightblue"),
c(0, max(TestBathy), "gray90", "gray10")),
land = TRUE, n = 15, lwd = 1, lty = 1, col = "black",
drawlabels = TRUE, xlab = "Longitude", ylab = "Latitude",
asp = 1,
#以下「base::plot」のオプション
#枠の描写有無
bty = "n",
#タイトルと体裁
main = "からだにいいもの TEST",
font.main = 2, col.main = "blue",
#軸の体裁
font.lab = 2, font.axis = 2, col.axis = "yellow",
xaxs = "r", tcl = 0.3)
#プロットにスケールを追加:scaleBathyコマンド
#bathy classを指定:matオプション
#kmに変換する経度数:degオプション;例では1=84km
#プロット位置:x/yオプション;"bottomleft","bottomright","topright","topleft"の
#いずれかでxオプションのみを指定するのが簡単です
#x/yオプションをキーワードで指定した時の相対位置:insetオプション
scaleBathy(mat = TestBathy, deg = 3,
x = "bottomleft", inset = 5,
angle = 90, lwd = 0.5, col = "black")
#plot.bathyコマンドプロットからインタラクティブに深度を取得:get.depthコマンド
#bathy classを指定:matオプション
GetPoint <- get.depth(mat = TestBathy, distance = TRUE)
#取得データからに選択点をプロット
points(GetPoint$lon, GetPoint$lat, pch = 21,
col = "black", bg = "yellow", cex = 2)
#指定したベルト範囲の深度を取得:get.boxコマンド
#bathy classを指定:bathyオプション
#座標範囲の指定:経度:x1,x2;緯度:y1,y2オプション
#幅を指定:widthオプション
#haversine Formulaの距離を算出:distanceオプション
#plot.bathyコマンドプロットからインタラクティブに地点を指定:locatorオプション;TRUE/FALSE
GetBoxTransect <- get.box(bathy = TestBathy,
x1 = 139, y1 = 43,
x2 = 146, y2 = 43,
width = 1,
locator = FALSE)
#結果を3Dプロット:公式サイトの資料より
#latticeパッケージがなければインストール
if(!require("lattice", quietly = TRUE)){
install.packages("lattice");require("lattice")
}
#プロット
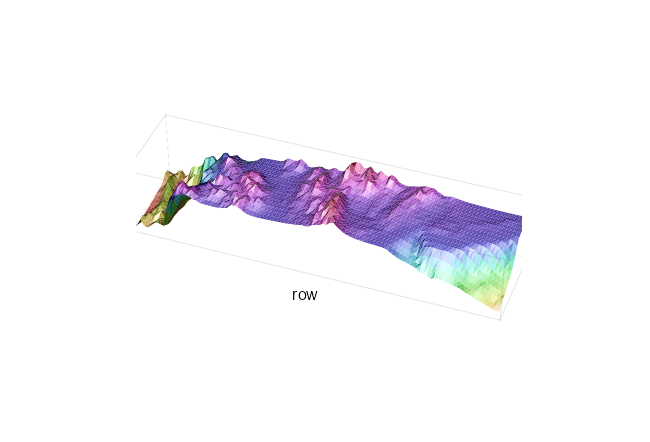
wireframe(GetBoxTransect, shade = TRUE, zoom = 1.2, aspect = c(1/4, 0.2),
screen = list(z =-20, x = -50),
par.settings = list(axis.line = list(col = "transparent")),
par.box = c(col = rgb(0, 0, 0, 0.1)))
#指定した座標範囲の深度を取得:get.transectコマンド
#bathy classを指定:matオプション
#座標範囲の指定:経度:x1,x2;緯度:y1,y2オプション
#haversine Formulaの距離を算出:distanceオプション
#plot.bathyコマンドプロットからインタラクティブに地点を指定:locatorオプション;TRUE/FALSE
GetTransect <- get.transect(mat = TestBathy,
x1 = 140, y1 = 41,
x2 = 140, y2 = 43,
locator = FALSE,
distance = TRUE)
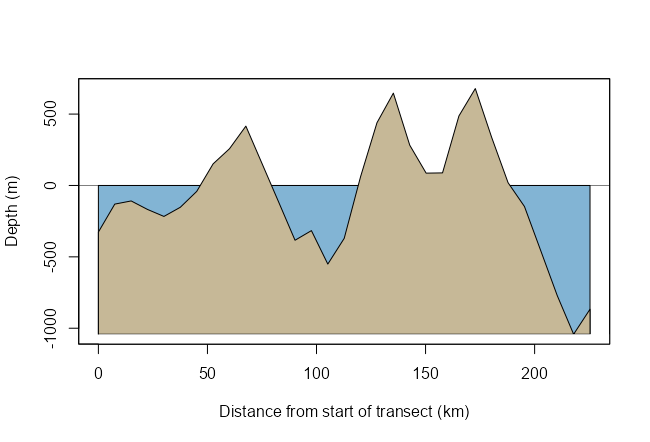
#get.transectコマンドの結果をプロット:plotProfileコマンド
#get.transectコマンドの結果を指定:profileオプション
plotProfile(profile = GetTransect)出力例
・コマンド例の初めからget.boxコマンドまで実行時
・結果を3Dプロット
・plotProfileコマンド
少しでも、あなたの解析が楽になりますように!!