The ‘tableone’ package displays the results of data processed in R in a table. As well as formatting and displaying the results in the R console, it also includes commands to output the results to a csv file.
This is recommended for those who wish to process the tables displayed in the console in ‘Excel’.
Package version is 0.13.0. Checked with R version 4.2.2.
<おすすめのRに関する書籍です>

Rによる多変量解析入門
Amazonで川端 一光, 岩間 徳兼, 鈴木 雅之のRによる多変量解析入門 データ分析の実践と理論。アマゾンならポイント還元本が多数。川端 一光, 岩間 徳兼, 鈴木 雅之作品ほか、
 www.amazon.co.jp
Install Package
Run the following command.
#Install Package
install.packages("tableone")
Example
See the command and package help for details.
#Loading the library
library("tableone")

######Creating Data########
set.seed(1234)
a <- sample(1:10, 100, replace = TRUE)
TestData <- data.frame(Group = factor(sample(paste0("Group", a),
                                             100, replace = TRUE)),
                       Data1 = a,
                       Data2 = c(-a[1:80], sample(210:230, 20, replace = TRUE)))
############################

#Turning data.frame into a table: the CreateTableOne command.
TestTable <- CreateTableOne(data = TestData)
TestTable

                   Overall
n                   100
Group (%)
Group1             3 ( 3.0)
Group10           15 (15.0)
Group2             2 ( 2.0)
Group3             8 ( 8.0)
Group4            18 (18.0)
Group5             6 ( 6.0)
Group6            20 (20.0)
Group7             5 ( 5.0)
Group8            13 (13.0)
Group9            10 (10.0)
Data1 (mean (SD))  5.68 (2.70)
Data2 (mean (SD)) 39.06 (90.31)

#Output from CreateTableOne with summary command
summary(TestTable)

### Summary of continuous variables ###

strata: Overall
n miss p.miss mean sd median p25 p75 min max skew kurt
Data1 100    0      0    6  3      6   4   8   1  10 0.02 -1.0
Data2 100    0      0   39 90     -5  -8  -2 -10 230 1.52  0.3

=======================================================================================

  ### Summary of categorical variables ###

  strata: Overall
var   n miss p.miss   level freq percent cum.percent
Group 100    0    0.0  Group1    3     3.0         3.0
Group10   15    15.0        18.0
Group2    2     2.0        20.0
Group3    8     8.0        28.0
Group4   18    18.0        46.0
Group5    6     6.0        52.0
Group6   20    20.0        72.0
Group7    5     5.0        77.0
Group8   13    13.0        90.0
Group9   10    10.0       100.0

#Processing numeric values with categorical variables: factorVars option
#Specify by column name
TestTable <- CreateTableOne(data = TestData, factorVars = colnames(TestData[2]))
TestTable

                   Overall
n                   100
Group (%)
Group1             3 ( 3.0)
Group10           15 (15.0)
Group2             2 ( 2.0)
Group3             8 ( 8.0)
Group4            18 (18.0)
Group5             6 ( 6.0)
Group6            20 (20.0)
Group7             5 ( 5.0)
Group8            13 (13.0)
Group9            10 (10.0)
Data1 (%)
1                  7 ( 7.0)
2                  6 ( 6.0)
3                 11 (11.0)
4                 13 (13.0)
5                 10 (10.0)
6                 17 (17.0)
7                  6 ( 6.0)
8                 11 (11.0)
9                  8 ( 8.0)
10                11 (11.0)
Data2 (mean (SD)) 39.06 (90.31)

#CSV output of tables to a working directory
#Output from CreateTableOne with print command
TestTable <- print(TestTable)

#Write a CSV File
write.csv(TestTable, file = "TestTable.csv")
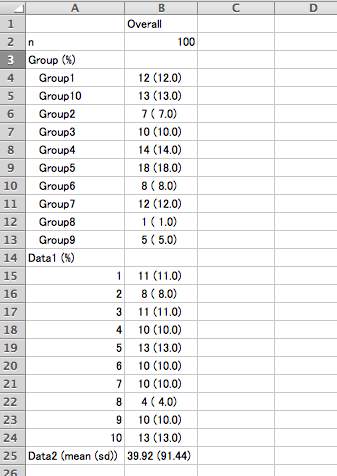
Output Example
Check the csv in Excel after applying the factorVars option.
I hope this makes your analysis a little easier !!