方位記号やスケールバーをplotコマンドで出力した図へ追記できるパッケージの紹介です。rasterパッケージとの組み合わせも面白いかもしれません。
方位記号とスケールバーを描写する「addnortharrow」と「addscalebar」、地名から緯度経度を取得する「searchbbox」コマンドを紹介します。
パッケージバージョンは0.2.3。windows 11のR version 4.1.3で確認しています。
パッケージのインストール
下記、コマンドを実行してください。
#パッケージのインストール
install.packages("prettymapr")
実行コマンド
詳細はコメント、パッケージのヘルプを確認してください。
#パッケージの読み込み
library("prettymapr")
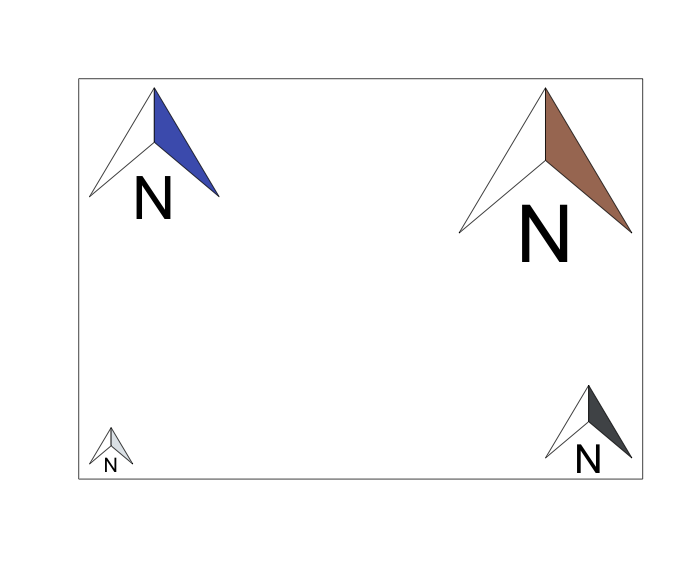
###方位記号の描写:addnortharrowコマンド#####
#描写の準備
plot(0:1, 0:1, type = "n", axes = FALSE, xlab = "", ylab = "")
box()
#描写位置の指定
Position <- c("bottomleft", "bottomright", "topleft", "topright")
#色の指定
Cols <- c("#e1e6ea", "#505457", "#4b61ba", "#a87963")
#矢印の描写
for(n in 1:4){
addnortharrow(pos = Position[n], padin = c(0.15, 0.15), scale = n,
lwd = 1, border = "black", cols = c("white", Cols[n]),
text.col = "black")
}
########
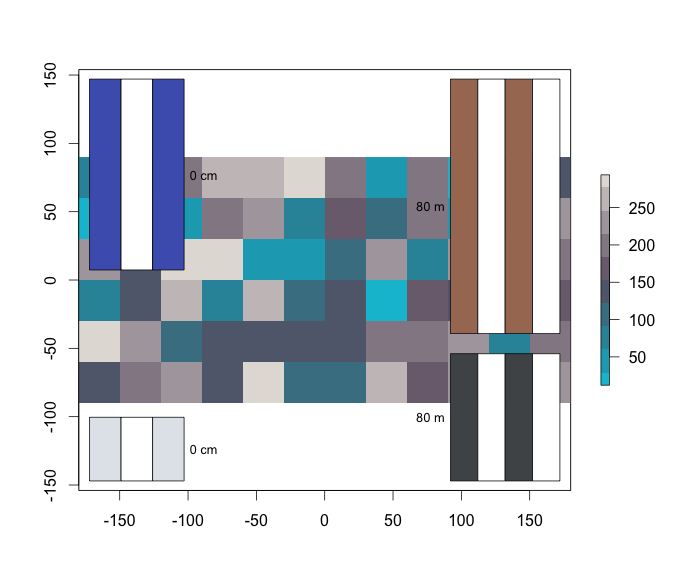
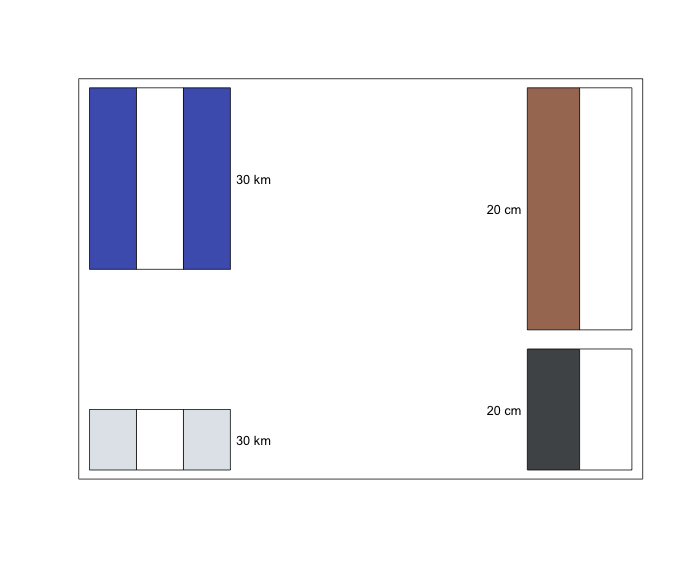
###スケールバーの描写:addscalebarコマンド#####
#描写の準備
plot(0:1, 0:1, type = "n", axes = FALSE, xlab = "", ylab = "")
box()
#描写位置の指定
Position <- c("bottomleft", "bottomright", "topleft", "topright")
#色の指定
Cols <- c("#e1e6ea", "#505457", "#4b61ba", "#a87963")
#スタイルの指定
Styles <- c("bar","ticks", "bar","ticks")
#緯度経度システムの設定
#lat/lon,Spherical Mercator otherwiseの順
LatLon <- c(4326, 3857, 4326, 3857)
#矢印の描写
for(n in 1:4){
addscalebar(plotunit = "cm", plotepsg = LatLon[n], widthhint = 0.25,
unitcategory = "metric", htin = n, padin = c(0.15, 0.15),
style = "bar", bar.cols = c(Cols[n], "white"), lwd = 1,
linecol = "black", tick.cex = 0.7, labelpadin = 0.08, label.cex = 0.8,
label.col = "black", pos = Position[n])
}
########
#緯度経度の取得:searchbboxコマンド
#PickPoint.io APIを利用
GetArea <- searchbbox("KYOTO")
#確認
GetArea
# min max
#x 135.55901 135.87844
#y 34.87492 35.32122出力例
・addnortharrowコマンド
・addscalebarコマンド
少しでも、あなたの解析が楽になりますように!!