Rで解析:ウィッチャーから発想を得たカラーパレット「thewitcher」パッケージ
Netflixやゲームで有名な「ウィッチャー」から発想を得たカラーパレットが35種類収録されているパッケージの紹介です。
収録カラーパレットは実行コマンドとRmdファイルで紹介します。実行前に「パッケージのインストール」のコマンドを実行してください。なお、実行はRStudioがおすすめです。
パッケージのバージョンは1.0.1。実行コマンドはRStudioのRStudio Desktop 2021.09.2+382、windows 11のR version 4.1.2で確認しています。
<おすすめのRに関する書籍です>

言葉と数式で理解する多変量解析入門 | 小杉 考司
Amazonで小杉 考司の言葉と数式で理解する多変量解析入門。アマゾンならポイント還元本が多数。小杉 考司作品ほか、お急ぎ便対象商品は当日お届けも可能。
パッケージのインストール
下記コマンドを実行してください。
install.packages("thewitcher")
install.packages("tidyverse")
install.packages("flexdashboard")
install.packages("DT")
スポンサーリンク
実行コマンドとRmdファイル
詳細はコマンド、Rmdファイル(エンコード:UTF-8)、パッケージヘルプを確認してください。
---
title: "thewitcherパッケージ"
output:
  flexdashboard::flex_dashboard:
    orientation: columns
    social: menu
    source_code: embed
runtime: shiny
---

```{r global, include=FALSE}
#必要パッケージの読み込み
library("thewitcher")
library("tidyverse")
library("flexdashboard")
library("DT")

###データ例の作成#####
n <- 100
TestData <- data.frame("Group" = sample(paste0("Group", 1:5), n, replace = TRUE),
                       "Data1" = sample(1:10, n, replace = TRUE),
                       "Data2" = sample(LETTERS[1:24], n, replace = TRUE))
########
#「thewitcher」パッケージ:カラーパレット名:35種類
GgSColName <- names(witcher_palettes)
```

Column {data-width=500}
-------------------------------------
```{r}
selectInput('Colpal', '収録カラーパレット:34種類', GgSColName)
```

```{r}
renderDataTable({
  PalData <- eval(parse(text = paste0("witcher_palettes", "$", input$Colpal)))
  ColCodeData <- data.frame("Color_Code" = PalData,
                            "Color" = "")
  datatable(ColCodeData, rownames = FALSE,
            options = list(pageLength = 7, lengthMenu = c(5, 10, 20))) %>%
    formatStyle("Color_Code", textAlign = "center") %>%
    formatStyle("Color", valueColumns = "Color_Code", color = "white",
                fontWeight = "bold", textAlign = "center",
                backgroundColor = styleEqual(ColCodeData[, 1], ColCodeData[, 1]))
})
```

###ggplot2:カラーパレット表示
```{r}
renderPlot({
  PalCol <- tibble(ColCode = eval(parse(text = paste0("witcher_palettes", "$", input$Colpal))))
  ggplot(PalCol, aes(x = ColCode, y = 1, fill = ColCode, label = ColCode)) +
  geom_raster() +
  annotate("rect", xmin = -Inf, xmax = Inf,
           ymin = 0.93, ymax = 1.07, alpha = 0.7, fill = "white") +
  geom_text(aes(label = input$Colpal, x = (nrow(PalCol)+1)/2, y = 1),
            color = "black", size = 8) +
  scale_fill_manual(values = as.character(PalCol$ColCode), guide = "none") +
  theme_void()
}, height = 200)
```

Column {data-width=500}
-------------------------------------
###ggplot2:colorに適応
```{r}
renderPlot({
  PalData <- eval(parse(text = paste0("witcher_palettes", "$", input$Colpal)))[1:5]
  ggplot(TestData,
         aes(x = Data1, y = Data2, col = Group)) +
    geom_point(size = 10) +
    theme_bw() +
    scale_color_manual(values = as.character(PalData)) +
    labs(title = paste0("パレット名:", input$Colpal))
}, height = 350)
```

###ggplot2:fillに適応
```{r}
renderPlot({
  PalData <- eval(parse(text = paste0("witcher_palettes", "$", input$Colpal)))[1:5]
  ggplot(TestData,
         aes(x = Data2, fill = Group)) +
    geom_bar(stat = "count") + theme_bw() +
    scale_fill_manual(values = as.character(PalData)) +
    labs(title = paste0("パレット名:", input$Colpal))
}, height = 350)
```
出力例
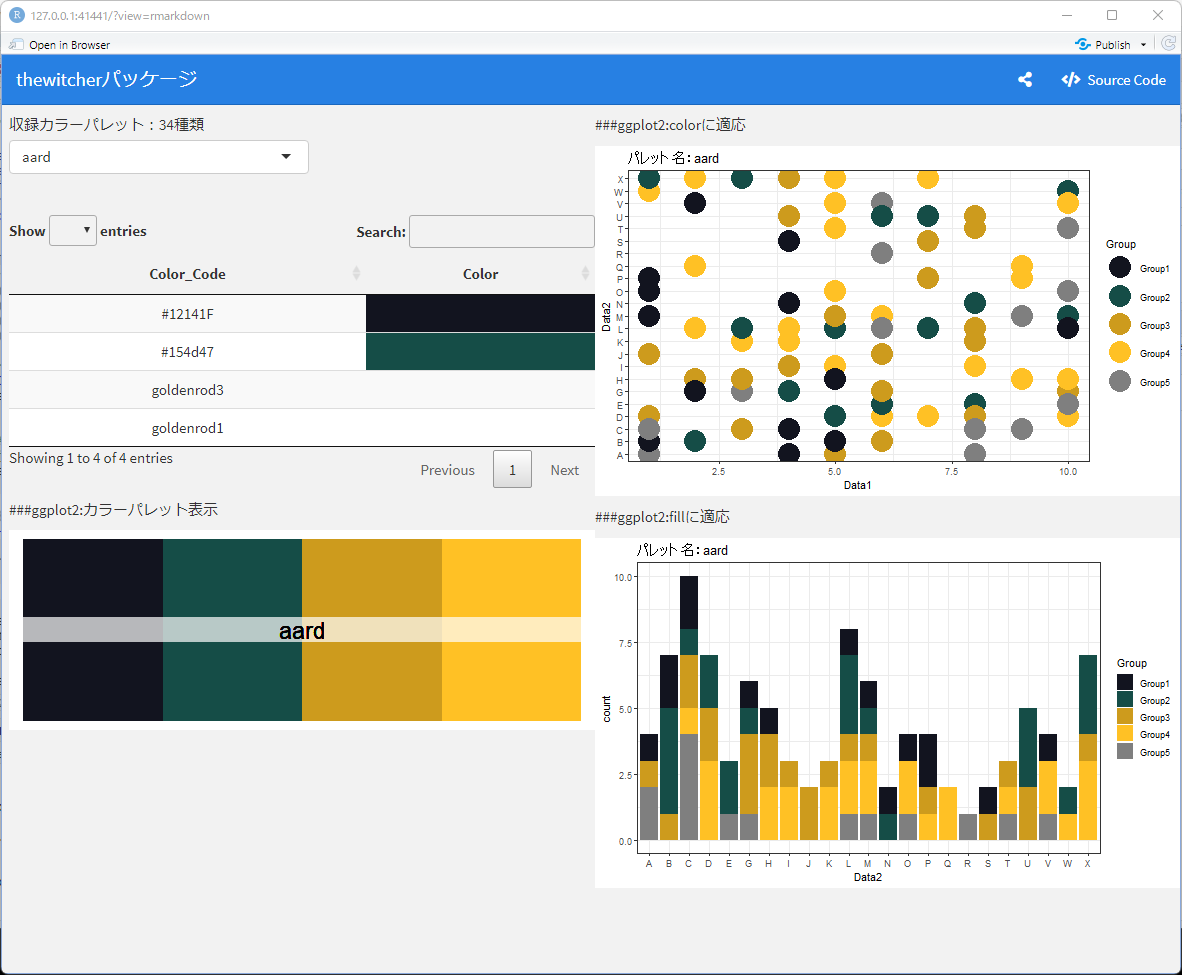
少しでも、あなたの解析が楽になりますように!!
スポンサーリンク