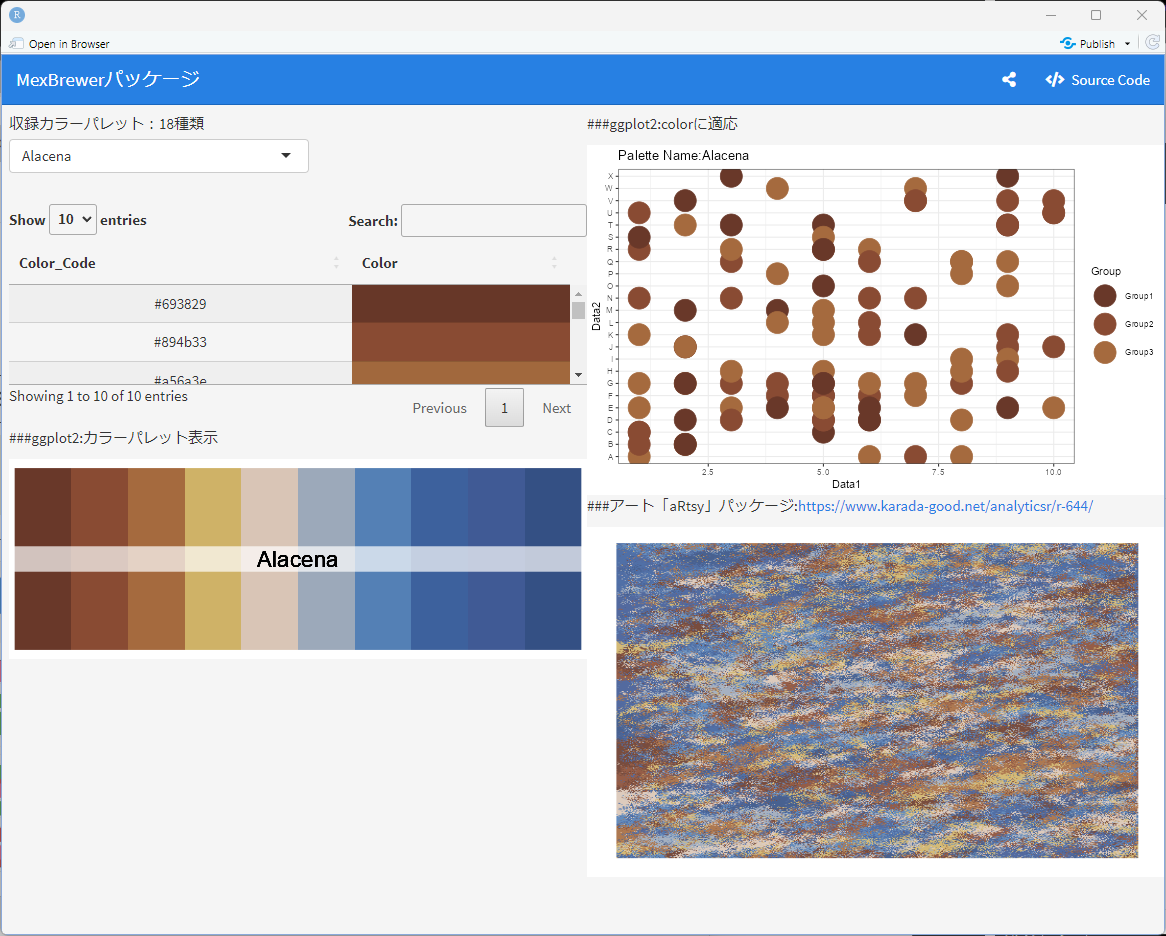
メキシコの画家や壁画家の作品からインスピレーションを得た18種類のカラーパレットが収録されたパッケージの紹介です。大変綺麗な色使いです。
パッケージのgiyhubページでは参考とした作品が紹介されています。
https://github.com/paezha/MexBrewer
収録カラーパレットは実行コマンドとRmdファイルで紹介します。実行前に「パッケージのインストール」のコマンドを実行してください。なお、実行はRStudioがおすすめです。
パッケージバージョンは0.0.2。実行コマンドはRStudioのRStudio 2022.12.0 Build 353、R version 4.2.2で確認しています。
パッケージのインストール
下記、コマンドを実行してください。
install.packages("MexBrewer")
install.packages("tidyverse")
install.packages("aRtsy")
install.packages("flexdashboard")
install.packages("DT")
実行コマンドとRmdファイル
詳細はコマンド、Rmdファイル(エンコード:UTF-8)、パッケージヘルプを確認してください。
---
title: "MexBrewerパッケージ"
output:
flexdashboard::flex_dashboard:
orientation: columns
social: menu
source_code: embed
runtime: shiny
---
```{r global, include=FALSE}
#必要パッケージの読み込み
library("MexBrewer")
library("tidyverse")
library("aRtsy")
library("flexdashboard")
library("DT")
###データ例の作成#####
n <- 100
TestData <- data.frame("Group" = sample(paste0("Group", 1:3), n, replace = TRUE),
"Data1" = sample(1:10, n, replace = TRUE),
"Data2" = sample(LETTERS[1:24], n, replace = TRUE))
########
#「MexBrewer」パッケージ:カラーパレット名:18種類
GgSColName <- names(MexPalettes)
```
## Column {data-width="500"}
```{r}
selectInput('Colpal', '収録カラーパレット:18種類', GgSColName)
```
```{r}
renderDataTable({
PalData <- eval(parse(text = paste0("MexPalettes$", input$Colpal, "[[1]]")))
ColCodeData <- data.frame("Color_Code" = PalData,
"Color" = "")
datatable(ColCodeData, rownames = FALSE,
options = list(pageLength = 10, lengthMenu = c(10, 20, 25))) %>%
formatStyle("Color_Code", textAlign = "center") %>%
formatStyle("Color", valueColumns = "Color_Code", color = "white",
fontWeight = "bold", textAlign = "center",
backgroundColor = styleEqual(ColCodeData[, 1], ColCodeData[, 1]))
})
```
###ggplot2:カラーパレット表示
```{r}
renderPlot({
PalCol <- tibble(ColCode = eval(parse(text = paste0("MexPalettes$", input$Colpal, "[[1]]"))))
ggplot(PalCol, aes(x = ColCode, y = 1, fill = ColCode, label = ColCode)) +
geom_raster() +
annotate("rect", xmin = -Inf, xmax = Inf,
ymin = 0.93, ymax = 1.07, alpha = 0.7, fill = "white") +
geom_text(aes(label = input$Colpal, x = (nrow(PalCol)+1)/2, y = 1),
color = "black", size = 8) +
scale_fill_manual(values = as.character(PalCol$ColCode), guide = "none") +
theme_void()
}, height = 200)
```
## Column {data-width="500"}
###ggplot2:colorに適応
```{r}
renderPlot({
PalData <- eval(parse(text = paste0("MexPalettes$", input$Colpal, "[[1]]")))
ggplot(TestData,
aes(x = Data1, y = Data2, col = Group)) +
geom_point(size = 10) +
theme_bw() +
scale_color_manual(values = as.character(PalData)) +
labs(title = paste0("Palette Name:", input$Colpal))
}, height = 350)
```
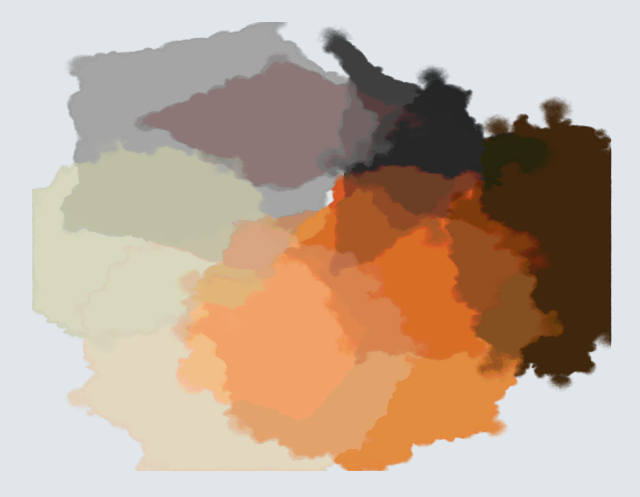
###アート「aRtsy」パッケージ:https://www.karada-good.net/analyticsr/r-644/
```{r}
renderPlot({
#ストロークで描写:canvas_strokesコマンド
canvas_strokes(colors = eval(parse(text = paste0("MexPalettes$",
input$Colpal, "[[1]]"))),
neighbors = 3, p = 0.05, iterations = 1,
resolution = 500)
}, height = 350)
```出力例
・アート「aRtsy」パッケージでの出力例
・Rmdファイル実行例
少しでも、あなたの解析が楽になりますように!!