からだにいいもの
 Analysis in R: Presents an example of obtaining color data from a plot
Here is a simple example of how to get a color code from a plot. The packages used are “grid” and “KaradaColor”. The key is the “grid” package.
Each package is up to date at the time of introduction, and execution commands are verified with R version 4.2.3.
<おすすめのRに関する書籍です>

東京大学のデータサイエンティスト育成講座 ~Pythonで手を動かして学ぶデ―タ分析~
データ分析の一連の流れを手を動かして学ぶ定番書。ただしコードはRではなくPython中心なので、その点は注意。
 www.amazon.co.jp
Example
See the command and package help for details.
#Install the grid package if it is not already present
if(!require("grid", quietly = TRUE)){
  install.packages("grid");require("grid")
}
#Install the KaradaColor package if it is not already present
if(!require("KaradaColor", quietly = TRUE)){
  install.packages("KaradaColor");require("grid")
}

#Create triad color with specified color:KaradaColor::kg_create_tc command
#Create data to be retrieved from clicked coordinates
img <- kg_create_tc(basecols = "green")

#Plot: grid::grid.newpage, grid::grid.raster command
grid.newpage()
grid.raster(as.matrix(t(img)), width = 1,
            height = unit(0.5, "npc"), interpolate = F)

#Capturing click data: grid::grid.locator command
GetValue <- grid.locator("npc")

#Get color code from data
col_code <- img[trunc(GetValue$x * nrow(img) + unit(1, "npc")), 1]

#Display color codes on console: KaradaColor::kg_show_console command
kg_show_console(col_code)
スポンサーリンク
Output Example
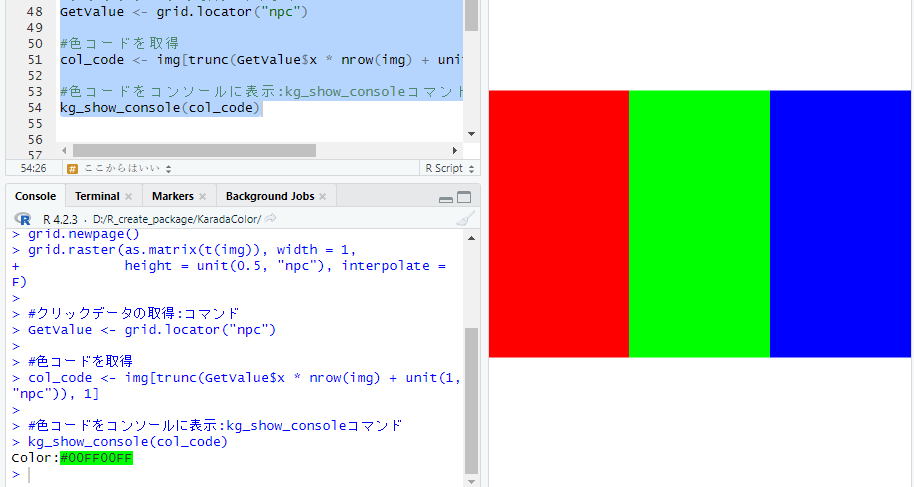
I hope this makes your analysis a little easier !!
<おすすめのRに関する書籍です>
Rで学ぶプログラミングの基礎の基礎 | 舟尾暢男
統計以前のプログラミングの考え方から始めるRの入門書。つまずきやすい部分を丁寧に扱う。
スポンサーリンク