複数の指標間の関係性を表現するUpSetプロットに情報の追加が簡単なパッケージの紹介です。UpSetプロットの表現を拡張できるのではないでしょうか。「ComplexUpset」パッケージ単独でも利用することができますが、「ggplot2」パッケージを利用して表現力のあるグラフの追加が可能です。
パッケージのバージョンは1.3.3。実行コマンドはwindows 11のR version 4.1.2で確認しています。
パッケージのインストール
下記コマンドを実行してください。
#パッケージのインストール
install.packages("ComplexUpset")
実行コマンド
詳細はコメント、パッケージヘルプを確認してください。
#パッケージの読み込み
library("ComplexUpset")
###データ例の作成#####
#tidyverseパッケージがなければインストール
if(!require("tidyverse", quietly = TRUE)){
install.packages("tidyverse");require("tidyverse")
}
set.seed(1234)
n <- 300
TestData <- tibble(Group = sample(paste0("Group", 1:4), n, replace = TRUE),
value = sample(c(1:10), n, replace = TRUE),
binary_Data_1 = sample(c(0:1), n, replace = TRUE),
binary_Data_2 = sample(c(0:1), n, replace = TRUE),
binary_Data_3 = sample(c(0:1), n, replace = TRUE),
binary_Data_4 = sample(c(0:1), n, replace = TRUE))
#binary_Dataの行名を取得
Binary_Name <- TestData %>%
select(contains("binary")) %>%
colnames()
########
#upsetのプロット:upsetコマンド
#Setsizeと交差行列のプロット横比率:width_ratioオプション
#Setsizeと交差行列のプロット縦比率:height_ratioオプション
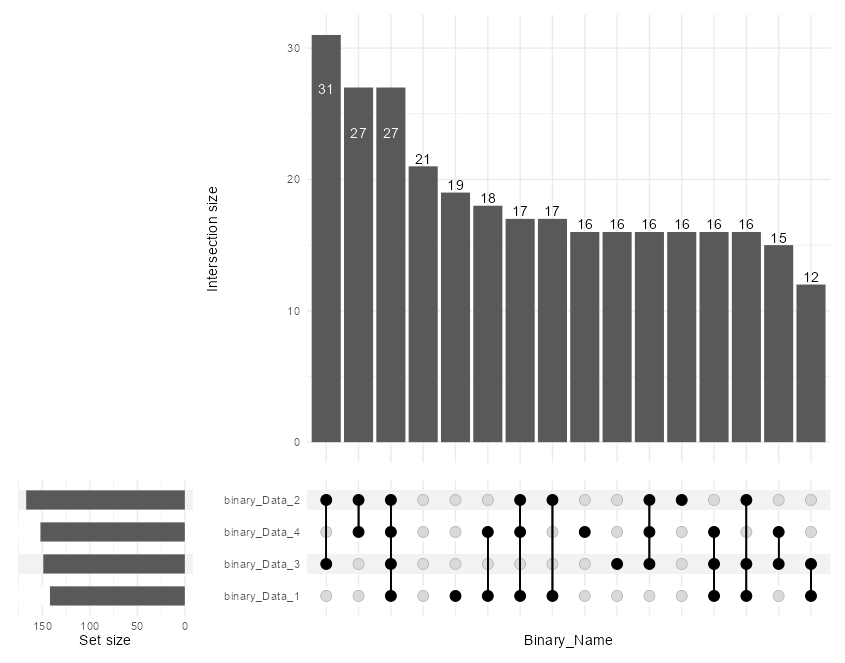
upset(TestData, Binary_Name, name = "Binary_Name",
width_ratio = 0.25, height_ratio = 0.3)
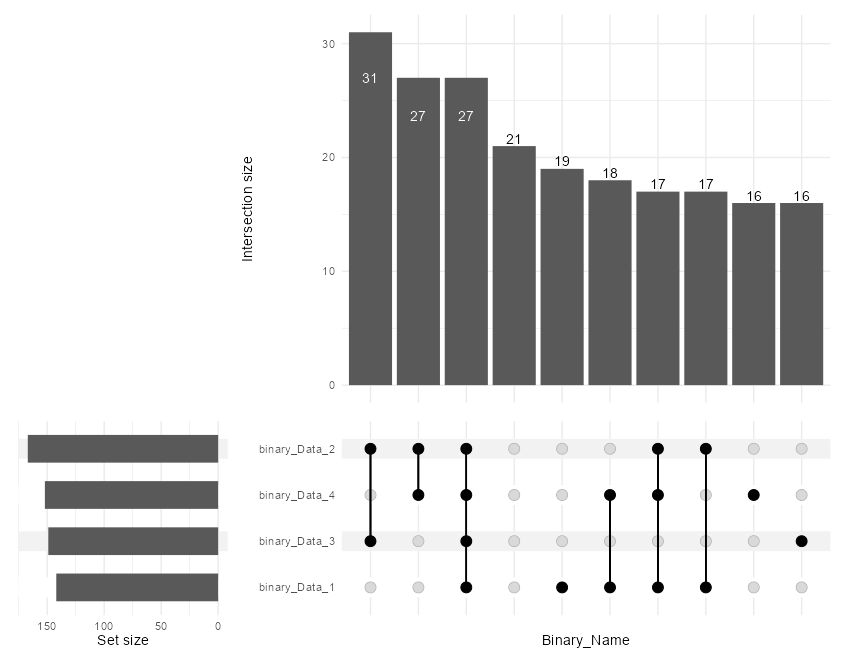
#表示する最小の交差の総数:min_sizeオプション
upset(TestData, Binary_Name, name = "Binary_Name",
width_ratio = 0.25, height_ratio = 0.2, min_size = 20,
wrap = TRUE, set_sizes = upset_set_size())
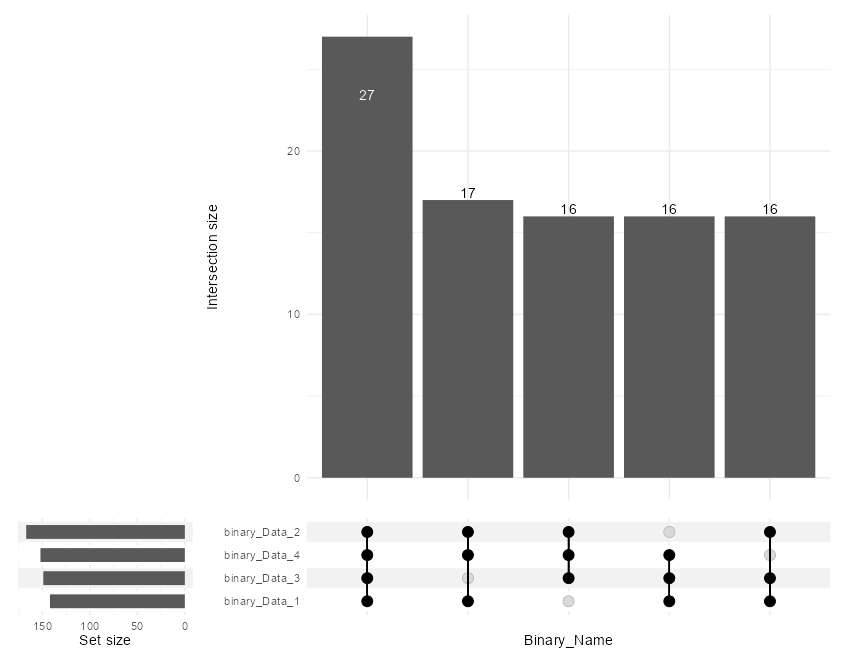
#表示する最小からの交差の数:min_degreeオプション/max_degree
upset(TestData, Binary_Name, name = "Binary_Name",
width_ratio = 0.25, height_ratio = 0.2, min_degree = 3)
#表示する交差の数:n_intersectionsオプション
upset(TestData, Binary_Name, name = "Binary_Name",
n_intersections = 10)
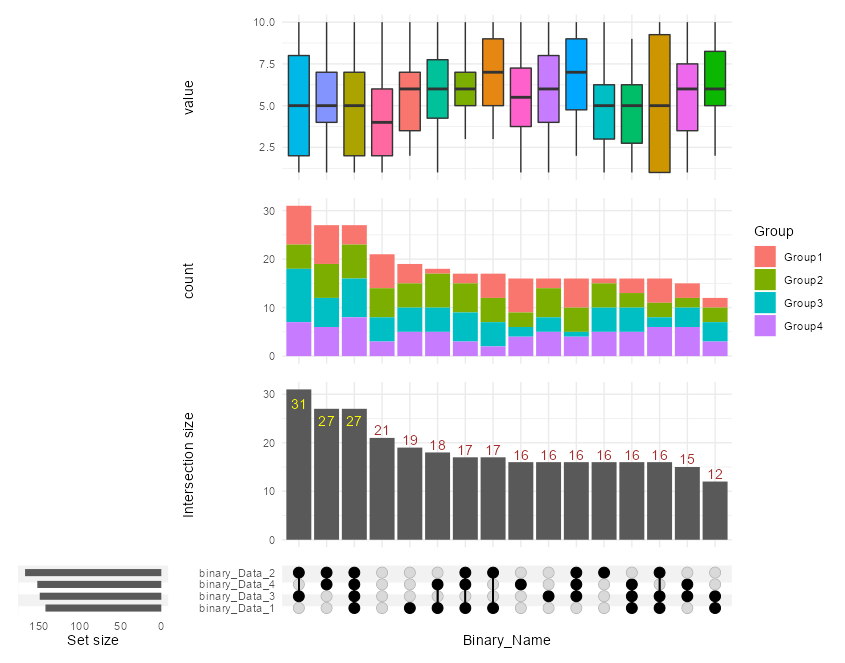
#「ggploy2」パッケージと組み合わせた利用例
#upsetの体裁を整える:base_annotationsオプション
#upsetへのアノテーションの体裁を整える:annotationsオプション
upset(TestData, Binary_Name, name = "Binary_Name",
width_ratio = 0.25, height_ratio = 0.3,
base_annotations = list(
#Intersection sizeの体裁
'Intersection size'= intersection_size(
#テキストの色
text_colors = c(on_background = "brown", on_bar = "yellow"),
#テキストの位置,回転
text = list(c(vjust = -0.1, hjust = -0.1, ngle = 45))
)
),
annotations = list(
#annotationsの体裁,ggplot2のコマンドが利用できます
#intersection sizeのプロットに合わせる:intersectionを設定する
#上段のannotations
"value" = ggplot(mapping = aes(x = intersection,
y = value,
group = intersection,
fill = intersection)) +
geom_boxplot() +
theme(legend.position = "none"),
#下段のannotations
"value_2" = ggplot(mapping = aes(fill = Group)) +
geom_bar(stat = "count", position = "stack")
)
)出力例
・upsetのプロット:upsetコマンド
・表示する最小の交差の総数:min_sizeオプション
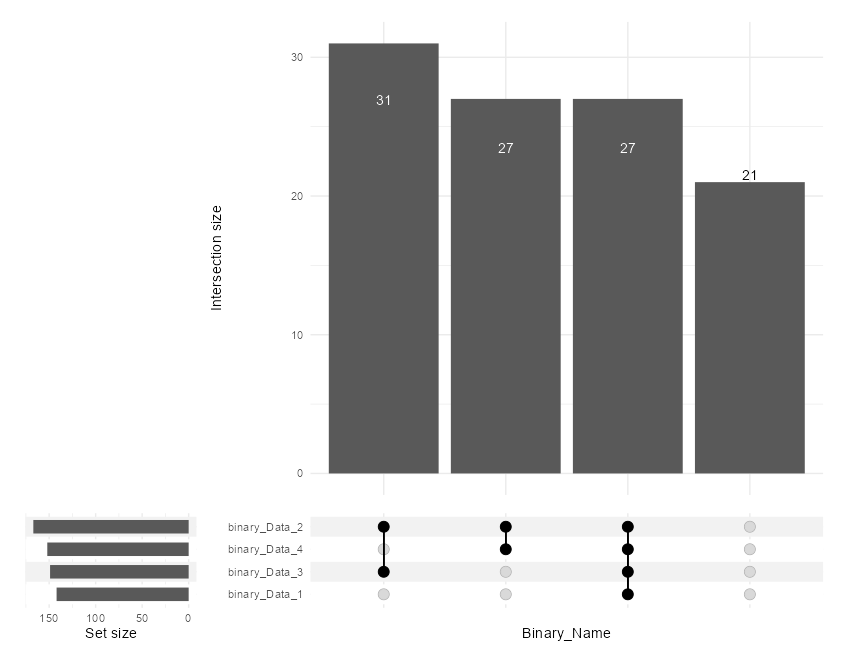
・表示する最小からの交差の数:min_degreeオプション/max_degree
・表示する交差の数:n_intersectionsオプション
・「ggploy2」パッケージと組み合わせた利用例
少しでも、あなたの解析が楽になりますように!!