「ggplot2」パッケージの「facet_wrap」や「facet_grid」コマンドを使いやすくするだけでなく、軸や凡例の体裁を色々整えることが可能なパッケージの紹介です。「ggplot2」パッケージ単独でも体裁を整えることが可能ですが、本パッケージを利用することで大幅な作業時間を短縮できると考えます。
パッケージバージョンは0.2.3。windows11のR version 4.2.2で確認しています。
パッケージのインストール
下記コマンドを実行してください。
#パッケージのインストール
install.packages("ggh4x")
実行コマンドの紹介
詳細はコマンド、パッケージのヘルプを確認してください。
#パッケージの読み込み
library("ggh4x")
###データ例の作成#####
#tidyverseパッケージがなければインストール
if(!require("tidyverse", quietly = TRUE)){
install.packages("tidyverse");require("tidyverse")
}
set.seed(1234)
n <- 50
TestData <- tibble(Group = sample(paste0("Group ", 1:2), n, replace = TRUE),
SubGroup = sample(paste0("SubGroup ", 1:3), n, replace = TRUE),
Data_X = 1:n,
Data_Y = rnorm(n))
########
###基準プロットの作成#####
TestPlot <- ggplot(TestData, aes(x = Data_X, y = Data_Y, color = Group)) +
geom_point() +
theme(axis.line = element_line(colour = "black"))
#####
#ggplot::facet_wrapの拡張:facet_wrap2コマンド
#facetsの条件を指定:facetsオプション;varsコマンドを使用して設定
#並べる行数,列数を設定:nrow,ncolオプション
#軸の固定方法:scalesオプション;"fixed","free_x","free_y","free"
#軸の表示設定:axesオプション;"margins","x","y","all"
#軸ラベルの表示設定:remove_labelsオプション;"none","x","y","all"
#axesオプションの軸に適応されます
#プロット方向:dirオプション;"h","v"
TestPlot +
facet_wrap2(facets = vars(Group), nrow = NULL, ncol = NULL,
scales = "free", axes = "margins",
remove_labels = "none",
shrink = TRUE, dir = "v")
#ggplot::facet_gridの拡張:facet_grid2コマンド
#オプションの多くはfacet_wrap2コマンドと共通
#列方向の分割指標:rowsオプション;varsコマンドを使用して設定
#行方向の分割指標:colsオプション;varsコマンドを使用して設定
TestPlot +
facet_grid2(rows = vars(Group), cols = vars(SubGroup),
scales = "fixed", space = "fixed",
axes = "margins", remove_labels = "none")
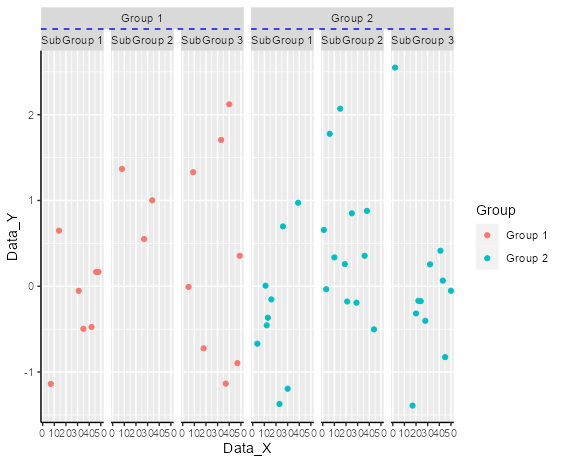
#入れ子のfacetプロット:facet_nestedコマンド
#ラベルの位置を指定:switchオプション;"x","y","both"
TestPlot +
facet_nested(~ Group + SubGroup,
nest_line = element_line(linetype = 2,
colour = "blue"),
switch = "y")
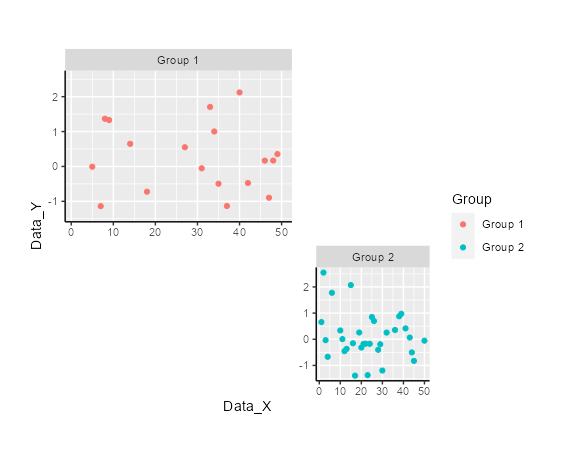
#レイアウトを指定してプロット:facet_manualコマンド
#レイアウトをmatrixで指定する
design <- matrix(c(1,2,1,2), 2, 2)
#プロット
TestPlot +
facet_manual(vars(Group), design = design)
#こんな使い方も出来ます
#レイアウトを文字と#(空白)で指定する
#改行で行を切り替える
design <- "
A#
#B
"
#プロット
TestPlot +
facet_manual(vars(Group), design = design,
heights = unit(c(4, 3), "cm"),
widths = unit(c(6, 3), "cm"))
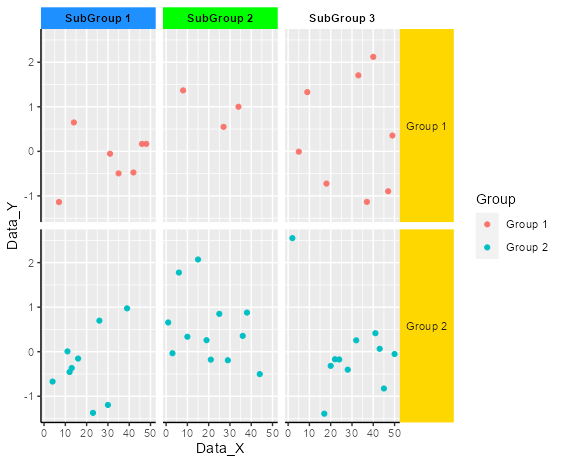
#各コマンドのstripオプションに体裁を適応する:strip_themedコマンド
TestStrip <- strip_themed(
#水平方向の体裁
#listで各ラベルの色を設定可能:fill,color
background_x =
list(element_rect(fill = "dodgerblue"),
element_rect(fill = "green"),
element_rect(fill = "white")),
text_x = elem_list_text(colour = "black",
face = "bold"),
#by_layer_xオプション:FALSE:異なる要素を個々に適応
by_layer_x = FALSE,
#垂直方向の体裁
background_y = elem_list_rect(
fill = c("gold", "red")
),
text_y = elem_list_text(angle = c(0, 45)),
#by_layer_yオプション:FALSE:異なる要素を個々に適応
by_layer_y = TRUE
)
#プロット
TestPlot +
facet_grid2(rows = vars(Group), cols = vars(SubGroup),
scales = "fixed", space = "fixed",
axes = "margins", remove_labels = "none",
strip = TestStrip)
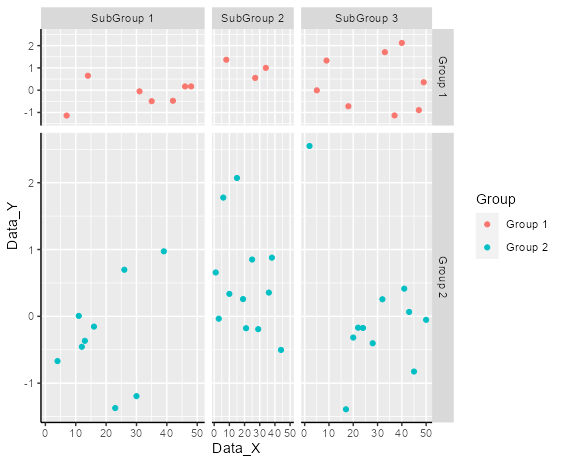
#facet_gridの各パネルサイズを調整:force_panelsizesコマンド
#列方向のサイズ:colsオプション
#行方向のサイズ:rowsオプション
#行列の比率を連動:respectオプション;TRUE/FALSE
TestPlot +
facet_grid(Group ~ SubGroup) +
force_panelsizes(cols = c(1, 0.5, 0.8),
rows = c(1, 3),
respect = FALSE)
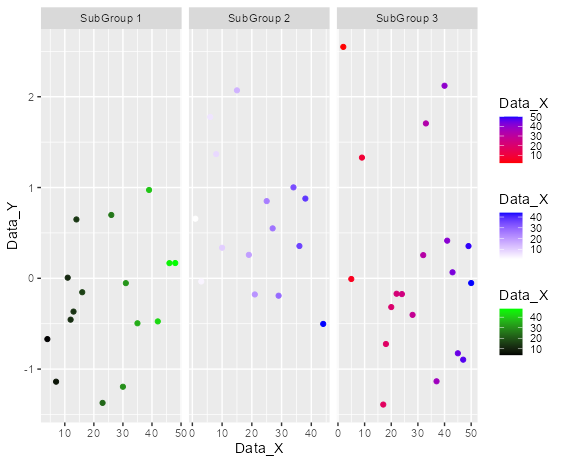
###facet_grid後の各グループへ色を設定する:scale_colour_multiコマンド#####
#データの作成:SubGroup毎にデータを適応する
TestPlot <- ggplot(TestData, aes(x = Data_X, y = Data_Y, color = Group)) +
geom_point(aes(SG1 = Data_X),
data = ~ subset(., SubGroup == "SubGroup 1")) +
geom_point(aes(SG2 = Data_X),
data = ~ subset(., SubGroup == "SubGroup 2")) +
geom_point(aes(SG3 = Data_X),
data = ~ subset(., SubGroup == "SubGroup 3"))
#scale_colour_multiコマンド
#適応するデータ名を指定:aestheticsオプション
TestPlot +
facet_wrap(~ SubGroup, scales = "free_x")+
scale_colour_multi(
aesthetics = c("SG1", "SG2", "SG3"),
colours = list(c("black", "green"),
c("white", "blue"),
c("red", "blue")),
guide = list(guide_colourbar(barheight = unit(35, "pt")))
)
#凡例を文字の色で表示する:scale_colour_brewer/scale_fill_brewerコマンド
#guidesコマンドに適応するguide_stringlegendコマンドもあります
TestPlot +
scale_colour_brewer(palette = "Dark2",
guide = "stringlegend")
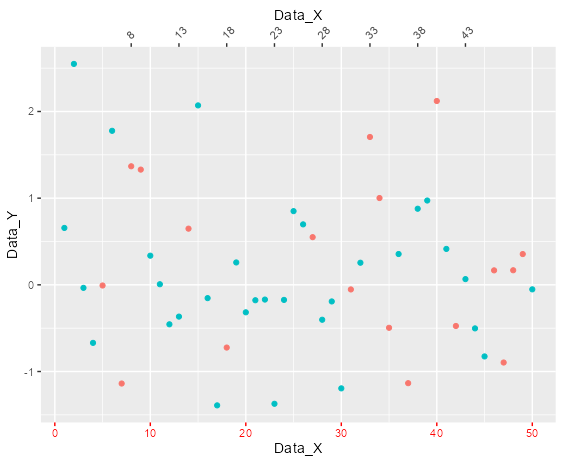
###scale_x/y_continuousコマンドに適応して軸の体裁を整える#####
TestPlot +
scale_x_continuous(
#軸の書式を指定:guide_axisコマンド
#sec.axisオプションと同時使用は不可
#位置:positionオプション;"top","bottom","left","right"
#ラベルの行/列数を指定:n.dodgeオプション
#guide = guide_axis(position = "top", angle = 90,
# n.dodge = 3),
#第2軸を指定:dup_axisコマンド
sec.axis = dup_axis(breaks = seq(from = 8, to = 45, by = 5),
guide = guide_axis(angle = 45)),
#軸の色を設定:guide_axis_colorコマンド
#「guides」コマンドの設定するguide_axis_truncatedコマンドもあります
#軸の描写範囲を指定:trunc_lower/trunc_upperオプション
guide = guide_axis_color(color = "red",
trunc_lower = unit(c(0.1, 0.3), "npc"),
trunc_upper = unit(c(0.2, 0.8), "npc"))
)
########出力例
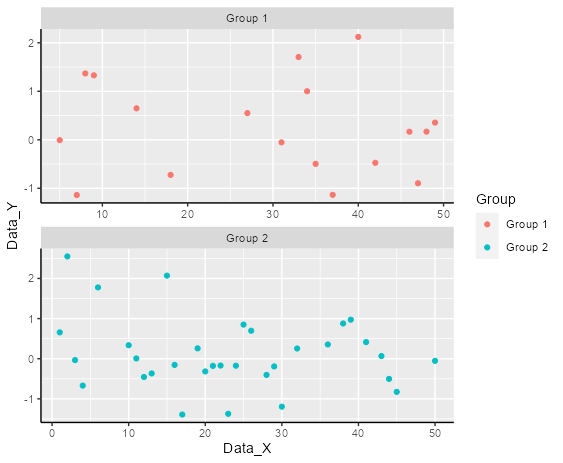
・facet_wrap2コマンド
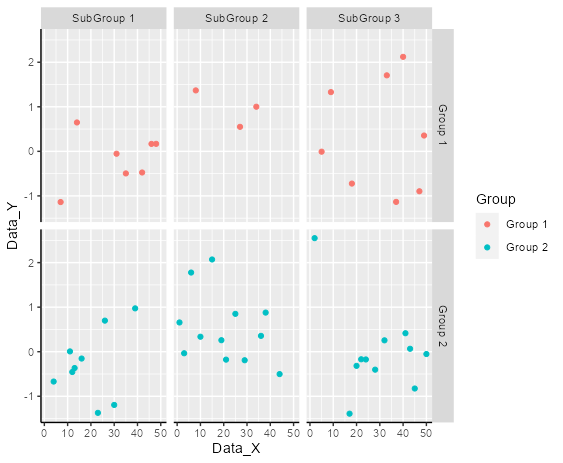
・facet_grid2コマンド
・facet_nestedコマンド
・facet_manualコマンド
・strip_themedコマンド
・force_panelsizesコマンド
・scale_colour_multiコマンド
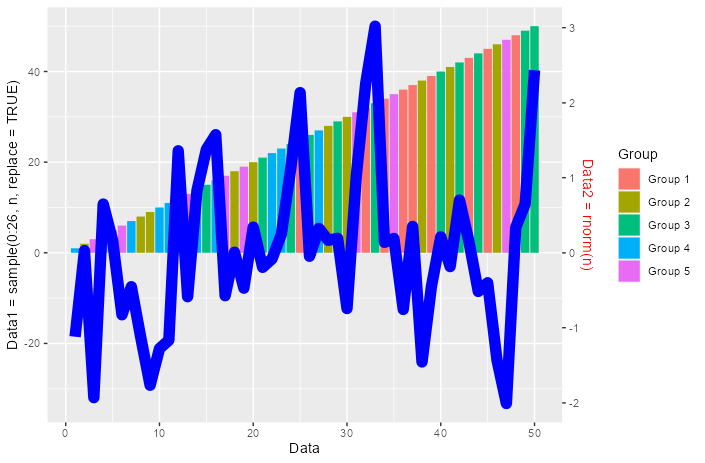
・guide_axisコマンド
少しでも、あなたの解析が楽になりますように!!