ggplot2でプロットできるコマンドの紹介です。ggplot2のインストールがまだであれば、下記コマンドを実行してください。
install.packages("ggplot2")プロット紹介
プロットの下にコマンド例を示します。色々試してみてください。
Bar Plot
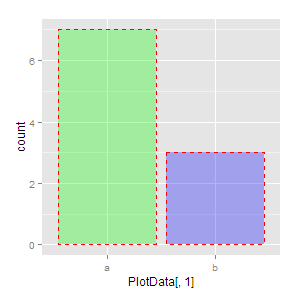
###データを作成#####
x <- c(rep("a", 7), rep("b", 3))
y <- rnorm(10, mean = rep(c(1,2), each = 5), sd = 0.4)
PlotData <- data.frame(x = x, y = y, row.names = c(1:10))
########
###プロット#####
p <- ggplot(PlotData, aes(x = PlotData[, 1]))
p + geom_bar(
#塗りの透明度
alpha = 0.3,
#線の色
colour = "red",
#塗りの色
fill = c("green", "blue"),
#線種 0:Blank, 1:Solid, 2:Dashed, 3:Dotted, 4:Dotdash, 5:Longdash, 6:Twodash
linetype = 2) #重み付けが必要な場合はweightを使用してください。
[/code]CrossBar Plot
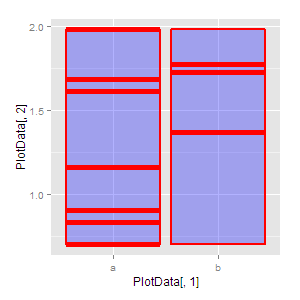
###データを作成#####
x <- c(rep("a", 7), rep("b", 3))
y <- rnorm(10, mean = rep(c(1,2), each = 5), sd = 0.4)
PlotData <- data.frame(x = x, y = y, row.names = c(1:10))
########
###プロット#####
p <- ggplot(PlotData, aes(x = PlotData[, 1],
y = PlotData[, 2],
ymin = min(PlotData[, 2]),
ymax = max(PlotData[, 2])))
p + geom_crossbar(
#塗りの透明度
alpha = 0.3,
#塗りの色
fill = "blue",
#線の色
colour = "red",
#線の太さ
size = 1,
#線種 0:Blank, 1:Solid, 2:Dashed, 3:Dotted, 4:Dotdash, 5:Longdash, 6:Twodash
linetype = 1) 等高線
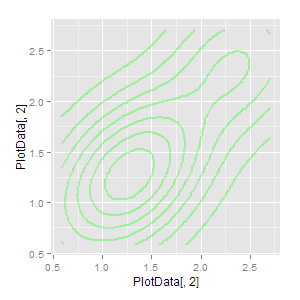
###データを作成#####
x <- c(rep("a", 7), rep("b", 3))
y <- rnorm(10, mean = rep(c(1,2), each = 5), sd = 0.4)
PlotData <- data.frame(x = x, y = y, row.names = c(1:10))
########
###プロット#####
p <- ggplot(PlotData, aes(x = PlotData[, 2], y = PlotData[, 2]))
p + geom_density2d(
#塗りの透明度
alpha = 0.3,
#線の色
colour = "green",
#線の太さ
size = 1,
#線種 0:Blank, 1:Solid, 2:Dashed, 3:Dotted, 4:Dotdash, 5:Longdash, 6:Twodash
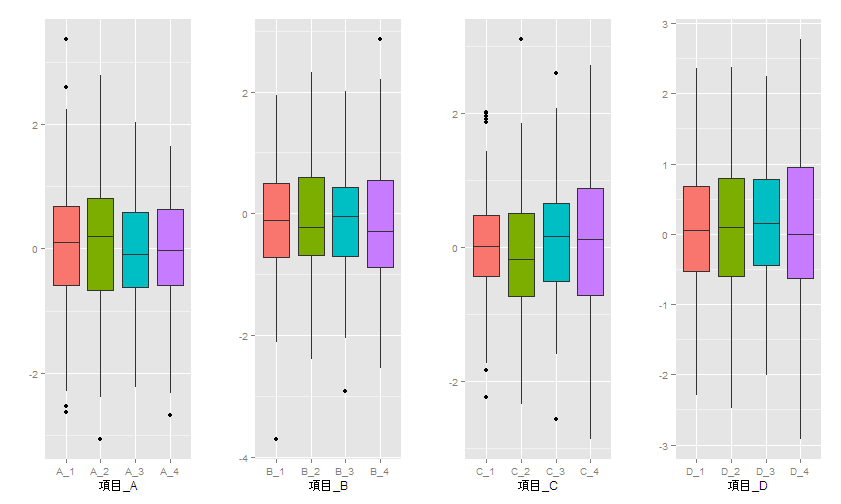
linetype = 1) BoxPlot
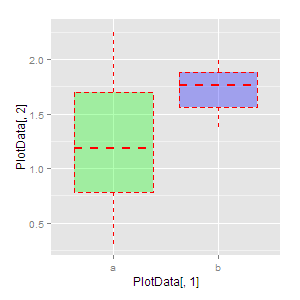
###データを作成#####
x <- c(rep("a", 7), rep("b", 3))
y <- rnorm(10, mean = rep(c(1,2), each = 5), sd = 0.4)
PlotData <- data.frame(x = x, y = y, row.names = c(1:10))
########
###プロット#####
p <- ggplot(PlotData, aes(x = PlotData[, 1], y = PlotData[, 2]))
p + geom_boxplot(
#外れ値の色
outlier.colour = NULL,
#外れ値のシンボル
outlier.shape = NULL,
#外れ値のシンボルの大きさ
outlier.size = NULL,
#ノッチ
notch = FALSE,
#ノッチの幅
notchwidth = 0.5,
#塗りの透明度
alpha = 0.3,
#線の色
colour = "red",
#塗りの色
fill = c("green", "blue"),
#線種 0:Blank, 1:Solid, 2:Dashed, 3:Dotted, 4:Dotdash, 5:Longdash, 6:Twodash
linetype = 2) 棒グラフ
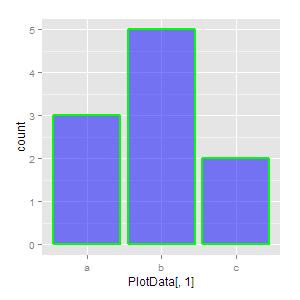
###データを作成#####
x <- c(rep("a", 3), rep("b", 5), rep("c", 2))
y <- rnorm(10, mean = rep(c(1,2), each = 5), sd = 0.4)
PlotData <- data.frame(x = x, y = y, row.names = c(1:10))
########
###プロット#####
p <- ggplot(PlotData, aes(x = PlotData[, 1]))
p + geom_histogram(
#色の透明度
alpha = 0.5,
#塗りの色
fill = "blue",
#線の色
colour = "green",
#線の太さ
size = 1,
#線種 0:Blank, 1:Solid, 2:Dashed, 3:Dotted, 4:Dotdash, 5:Longdash, 6:Twodash
linetype = 1) 少しでも、あなたの解析が楽になりますように!!