地図をプロットするパッケージは数多くありますが、地球規模のデータ表示に役に立つパッケージの紹介です。コマンド例では2022/9/22に発生した台風NORUの台風経路も合わせて紹介します。使いやすいパッケージです。
パッケージバージョンは1.2-0。windows11のR version 4.2.2で確認しています。
パッケージのインストール
下記、コマンドを実行してください。
#パッケージのインストール
install.packages("globe")
実行コマンド
詳細はコメント、パッケージのヘルプを確認してください。
#パッケージの読み込み
library("globe")
#配列を緯度・軽度のリスト式に変換:ensurelonlatコマンド
#札幌駅の位置を指定
LonLatData <- ensurelonlat(c(141.21, 43.3))
#指定位置を中心にした地球儀をプロット:globeearthコマンド
#表示位置の指定:eyeオプション;list(lon,lat)で指定するか,以下より選択
#‘nedlands’,‘curtin’,‘perth’,‘northpole’,‘southpole’,‘casey’,‘mawson’,
#‘madrid’,‘aarhus’,‘aalborg’,‘newyorkcity’,‘titanic’,‘pyongyang’,‘everest’,‘kilimanjaro’
#頂点位置を指定:topオプション
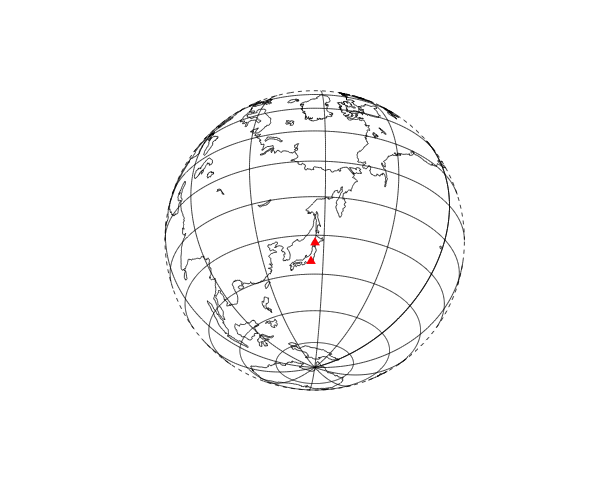
globeearth(eye = LonLatData, top = place("northpole"))
#プロットした地球儀にシンボルを追加:globepointsコマンド
#場所を指定:locオプション;matrixで指定
#baseのplotを利用しているのでplotのオプション使用が可能です
#新千歳空港と羽田空港を指定
LocPoint <- t(matrix(c(141.40, 42.47, 139.46, 35.32), nrow = 2, ncol = 2))
globepoints(loc = LocPoint, eye = LonLatData, top = place("northpole"),
col = "red", pch = 17)
#プロットした地球儀に経線を追加:globedrawlatコマンド
globedrawlat(lat = seq(-90, 90, 15))
#プロットした地球儀に緯線を追加:globedrawlongコマンド
globedrawlong(lon = seq(-180,180,30))
#プロットした地球儀に線を追加:globearrowsコマンド
#線の長さ:lenオプション
globearrows(loc = LocPoint, eye = LonLatData, top = place("northpole"),
col = "red", len = 3.5)
#世界地図を描写:flatearthコマンド
#図法を指定:projectionオプション;atlas:アトランティス図法,cylindrical:円筒図法
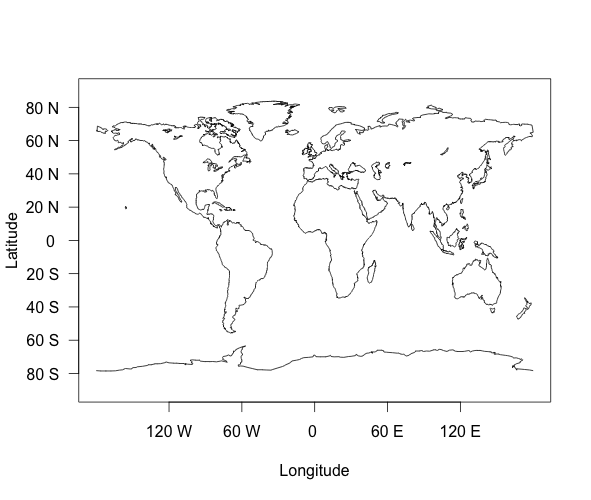
flatearth("atlas")
#プロットした世界地図にシンボルを追加:flatpointsコマンド
#オプションはglobepointsコマンドとほぼ同じです
flatpoints(loc = LocPoint, col = "red", pch = 17)
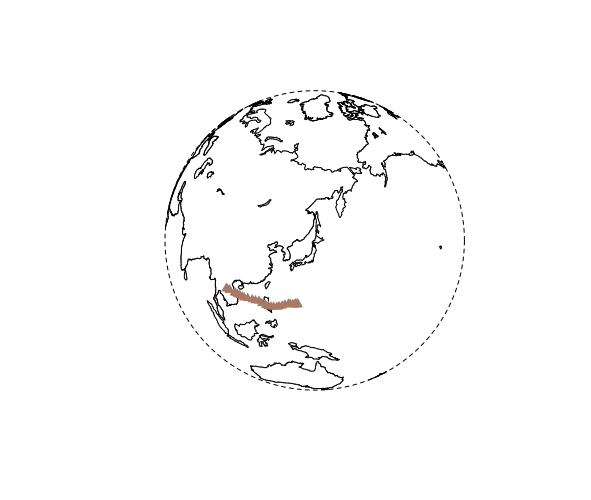
#参考:2022/9/22に発生した台風NORUの台風経路
#気象庁:https://www.data.jma.go.jp/yoho/typhoon/position_table/table2022.csv
TyphoonPoint <- t(matrix(c(133, 17.4, 133.7, 17.6, 134.2, 17.7,
134.4, 17.7, 134.4, 17.9, 134.1, 18,
133.5, 17.9, 132.4, 17.6, 131.3, 17.6,
130.6, 17.5, 129.2, 16.9, 128.1, 16.3,
126.9, 15.8, 126, 15.4, 124.7, 15.2,
123.6, 15, 122.5, 15, 121.4, 15.2,
119.7, 15.5, 118.4, 16.2, 116.9, 15.9,
115.5, 15.9, 113.5, 15.8, 112, 15.5,
111.2, 15.6, 109.9, 15.8, 108.8, 15.8,
107.9, 15.9, 107.3, 15.9, 105, 16,
104.9, 16, 103.9, 16, 103.3, 16),
nrow = 2))
globeearth(eye = LonLatData, top = place("northpole"))
globepoints(loc = TyphoonPoint, eye = LonLatData, top = place("northpole"),
col = "#a87963", pch = 17)出力例
・globeearthコマンドに点や緯線などを追加した例
・flatearthコマンド
・台風26の台風経路
少しでも、あなたの解析が楽になりますように!!