データの流れを指標や時間軸で表現するのに便利なAlluvial diagrams(沖積図)です。「ggplot2」パッケージを使用したパッケージですので、「ggplot2」パッケージのコマンドが利用可能です。「ggplot2」パッケージ のコマンドと合わせて利用するパッケージです。実際の作業に合わせて実行コマンドを紹介します。
パッケージバージョンは0.12.3。実行コマンドはwindows 11のR version 4.1.2で確認しています。
パッケージのインストール
下記コマンドを実行してください。
#パッケージのインストール
install.packages("ggalluvial")
実行コマンド
詳細はコマンド、パッケージのヘルプを確認してください。
#パッケージの読み込み
library("ggalluvial")
###データ例の作成#####
#tidyverseパッケージを読み込み
#tidyverseパッケージがなければインストール
if(!require("tidyverse", quietly = TRUE)){
install.packages("tidyverse");require("tidyverse")
}
#作成
n <- 30
set.seed(1234)
TestData <- tibble(Group = factor(sample(paste0("Group", 1:3),
n, replace = TRUE)),
Judge = factor(sample(c("Yes", "No"),
n, replace = TRUE)),
Device = factor(sample(c("Pc", "Mobile", "Tablet"),
n, replace = TRUE)),
Freq = sample(0:50, n, replace = TRUE))
#確認
TestData
# A tibble: 30 x 4
Group Judge Device Freq
<fct> <fct> <fct> <int>
1 Group2 No Pc 32
2 Group1 Yes Pc 7
3 Group1 Yes Pc 7
4 Group1 Yes Pc 21
5 Group1 No Tablet 41
6 Group2 Yes Tablet 36
7 Group2 No Mobile 11
8 Group2 Yes Pc 41
9 Group3 Yes Mobile 19
10 Group2 Yes Mobile 32
# ... with 20 more rows
#単色カラーパレット作成で「monochromeR」パッケージを使用
#記事:https://www.karada-good.net/analyticsr/r-647/
#monochromeRパッケージを読み込み
#monochromeRパッケージがなければインストール
if(!require("monochromeR", quietly = TRUE)){
install.packages("monochromeR");require("monochromeR")
}
#作成
ColPal <- generate_palette(colour = "#4b61ba", blend_colour = "red",
n_colours = 10, view_palette = FALSE,
view_labels = FALSE)
########
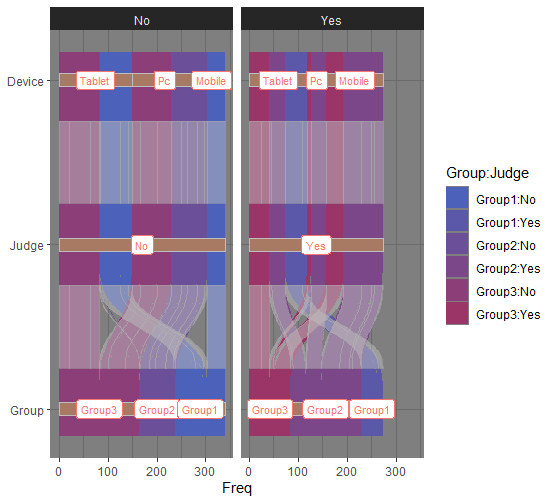
###沖積図をプロット例#####
##ggplot2::ggplotコマンド##
#aes内に沖積図の分岐点,y軸の設定を記述します
#分岐点:axisXX;設定する分岐点を記述します
ggplot(TestData, aes(axis1 = Group,
axis2 = Judge,
axis3 = Device,
y = Freq)) +
##ggalluvial::geom_alluviumコマンド;沖積図を描写
#aes内に装飾の設定を記述します;ggplot2と同じ設定が使用できます
#分岐での塗条件は例のように複数設定できます
geom_alluvium(aes(fill = Group:Judge), alpha = 1) +
##ggalluvial::geom_flowコマンド;分岐周辺以外をマスキング
#マスキング領域の設定:widthオプション
geom_flow(stat = "alluvium", lode.guidance = "frontback",
color = "darkgray", width = .5, curve_type = "quintic") +
##ggplot2::scale_fill_manualコマンド;カラーパレットを指定
scale_fill_manual(values = ColPal) +
##ggalluvial::geom_stratumコマンド;分岐点に垂直に棒グラフを描写
#widthを1にするとモザイクプロット風になります
geom_stratum(width = 1/13, fill = "#a87963", color = "grey") +
##ggplot2::geom_labelコマンド;"stratum"を設定することがポイントです
geom_label(stat = "stratum", aes(label = after_stat(stratum),
col = "red"),
size = 3, show.legend = FALSE) +
##ggplot2::scale_x_discreteコマンド;x軸のラベル設定
scale_x_discrete(limits = c("Group", "Judge", "Device"),
expand = c(.1, .1)) +
##ggplot2::facet_wrapコマンド;プロット分割
facet_wrap(~ Judge) +
##ggplot2::coord_flipコマンド;x,y軸の入れ替え
coord_flip() +
##ggplot2::theme_darkコマンド;テーマの適応
theme_dark()出力例
少しでも、あなたの解析が楽になりますように!!