Shinyの習作、その4です。出力したプロットからインタラクティブにデータを取得する例です。
RStudioのversion 2022.12.0 Build 353。R version 4.2.2で動作を確認しています。
コマンドの紹介
詳細はコマンド、各パッケージのヘルプを確認してください。実行コマンドが短いのでui.Rとserver.Rに分けずに紹介します。コンソールにペーストして実行すると動作します。
#パッケージの読み込み
if (!require("shiny")) {
install.packages("shiny")}
if (!require("ggplot2")) {
install.packages("ggplot2")}
###データ例の作成#####
n <- 50
TestData <- data.frame("Group" = sample(paste0("Group", 1:5), n, replace = TRUE),
"Data1" = sample(1:10, n, replace = TRUE),
"Data2" = sample(1:10, n, replace = TRUE))
########
#GUI設定
ui <- fluidPage(
fluidRow(
#fluidRow内に記述すると横並び
column(width = 4,
#ggplotをプロット
plotOutput("ggplot", height = 300,
#plotをインタラクティブに選択する:brushOptsオプション
#選択エリアの塗色を指定:fillオプション
brush = brushOpts(
id = "plot_brush", fill = "yellow"
)
)),
column(width = 4,
#barplotをプロット
plotOutput("barplot", height = 300)
)
),
fluidRow(
column(width = 4,
p("選択範囲に含まれる情報"),
#処理結果を整形して出力:verbatimTextOutputコマンド
verbatimTextOutput("brushData")
)
)
)
#処理内容設定
server <- function(input, output) {
#ggplot2処理
output$ggplot <- renderPlot({
ggplot(TestData, aes(Data2, Data1)) +
geom_point(aes(col = topo.colors(nrow(TestData)))) +
guides(colour = FALSE)
})
#barplot処理
output$barplot <- renderPlot({
if(length(GetData()[, 1]) >= 1){
barplot(xtabs(~as.character(GetData()[, 1])), col = topo.colors(5))
}else{}
})
#選択範囲のデータ出力
output$brushData <- renderPrint({
brushedPoints(GetData(), input$plot_brush)
})
#選択範囲のデータを取得
GetData <- reactive({
brushedPoints(TestData, input$plot_brush)
})
}
#shinyアプリ起動
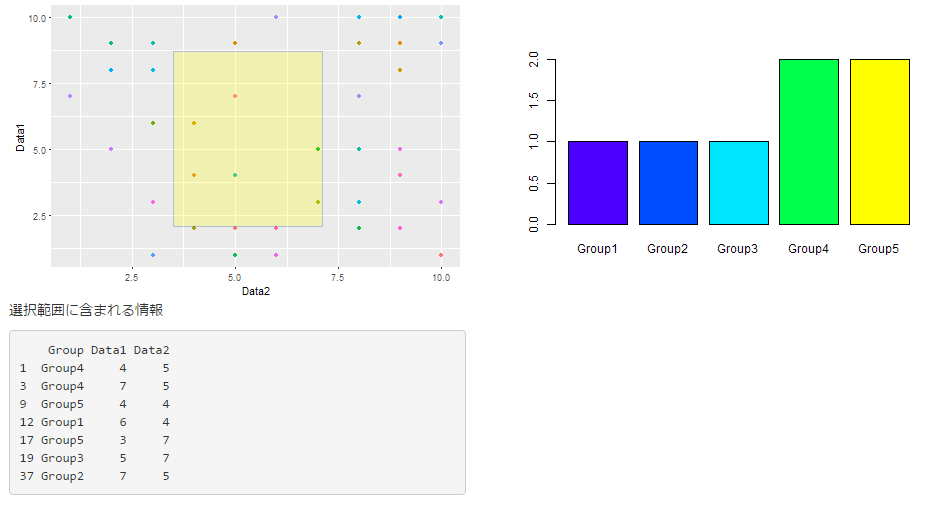
shinyApp(ui, server)実行例
・Chromeでの実行例です。
少しでも、あなたの解析が楽になりますように!!