Rで解析:ggplotでツリーマップ「treemapify」パッケージ
「ggplot2」パッケージを利用して、ツリーマップを描写するのに便利なパッケージの紹介です。gganimateパッケージのtransition_timeコマンドを利用してgifアニメーションの作成例も「コマンドの紹介」最下部に紹介します。
パッケージバージョンは2.5.5。実行コマンドはwindows 11のR version 4.1.2で動作を確認しています。
<おすすめのRに関する書籍です>

RとRStudioによる教育テストデータの分析 | 堀 一輝, 福原 弘岳, 山田 剛史
Amazonで堀 一輝, 福原 弘岳, 山田 剛史のRとRStudioによる教育テストデータの分析。アマゾンならポイント還元本が多数。
パッケージのインストール
下記コマンドを実行してください。
#パッケージのインストール
install.packages("treemapify")
スポンサーリンク
コマンドの紹介
詳細はコマンド、パッケージのヘルプを確認してください。
#パッケージの読み込み:libraryコマンド
library("treemapify")
#ggplot2を利用するためにtidyverseパッケージを読み込み
#tidyverseパッケージがなければインストール
if(!require("tidyverse", quietly = TRUE)){
install.packages("tidyverse");require("tidyverse")
}
###データ例の作成#####
n <- 24
TestData <- data.frame("SubGroup" = sample(c("KA", "RA", "DA"), n, replace = TRUE),
"ID" = sample(letters[1:24], n, replace = FALSE),
"Area" = 1:n, "Point" = 0.1:(0.1*n),
"Facet" = sample(letters[1:2], n, replace = TRUE))
########
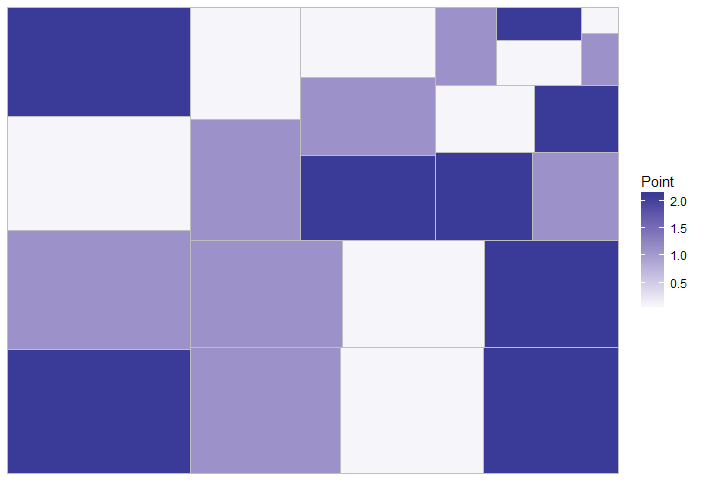
#ツリーマップ作成:geom_treemapコマンド
ggplot(TestData, aes(area = Area, fill = Point)) +
geom_treemap() +
scale_fill_gradient2()
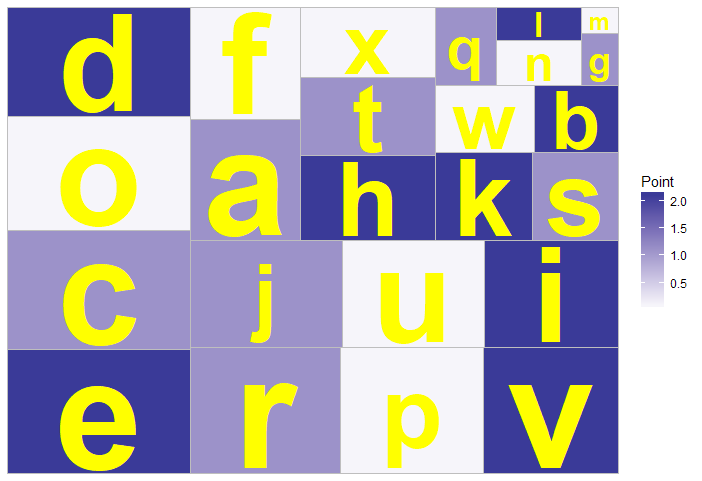
#ツリーマップにテキストを追加:geom_treemap_textコマンド
#書式設定:fontfaceオプション
#エリアサイズに文字サイズを合わせる:geouオプション
ggplot(TestData, aes(area = Area, fill = Point, label = ID)) +
geom_treemap() +
geom_treemap_text(fontface = "bold", colour = "yellow",
place = "centre", grow = TRUE) +
scale_fill_gradient2()
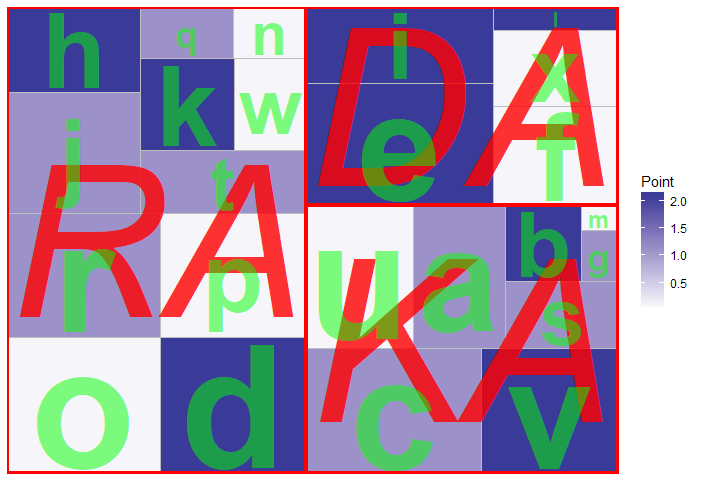
#ツリーマップにサブグループの情報を付与:geom_treemap_subgroup_XXXコマンド
###分割線を追加:geom_treemap_subgroup_borderコマンド
###テキストを追加:geom_treemap_subgroup_textコマンド
ggplot(TestData, aes(area = Area, fill = Point,
label = ID, subgroup = SubGroup)) +
geom_treemap() + geom_treemap_subgroup_border(colour = "red") +
geom_treemap_subgroup_text(place = "centre", grow = TRUE,
alpha = 0.8, colour = "red",
fontface = "italic", min.size = 0) +
geom_treemap_text(fontface = "bold", colour = "green",
place = "centre", grow = TRUE, alpha = 0.5) +
scale_fill_gradient2()
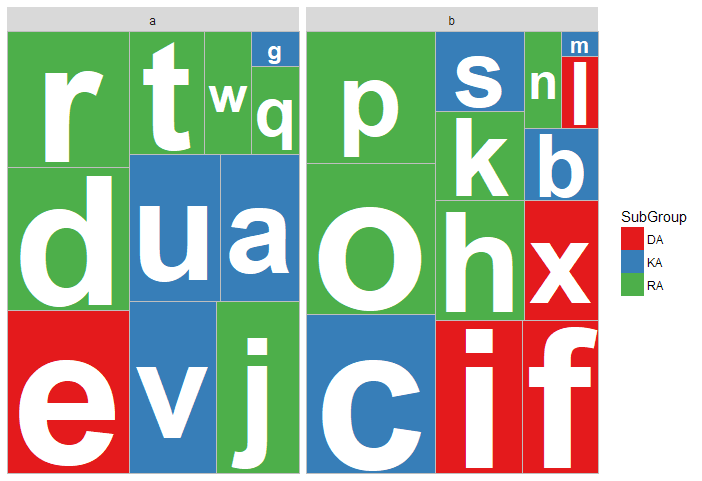
#参考:facet表示;ggplot2::facet_wrapコマンドを適応
ggplot(TestData, aes(area = Area, fill = SubGroup, label = ID)) +
geom_treemap() +
geom_treemap_text(fontface = "bold", colour = "white",
place = "centre", grow = TRUE) +
facet_wrap( ~ Facet) + scale_fill_brewer(palette = "Set1")
###参考:gifアニメーション######
#gganimateパッケージがなければインストール
if(!require("gganimate", quietly = TRUE)){
install.packages("gganimate");require("gganimate")
}
###データ例の作成#####
n <- 150
TestData <- data.frame("SubGroup" = sample(c("KA", "RA", "DA"), n, replace = TRUE),
"ID" = sample(letters[1:24], n, replace = TRUE),
"Area" = 1:n, "Point" = 0.1:(0.1*n),
"Facet" = sample(letters[1:2], n, replace = TRUE),
"No" = sample(1:10, n, replace = TRUE))
########
#gganimateパッケージのtransition_timeコマンドを使う
AnimePlot <- ggplot(TestData, aes(area = Area, fill = Point, label = ID)) +
geom_treemap() +
geom_treemap_text(fontface = "bold", colour = "yellow",
place = "centre", grow = TRUE) +
scale_fill_gradient2() +
transition_time(No) +
labs(title = "No: {frame_time}")
#作業フォルダに保存
anim_save("KARADA_treemap.gif", AnimePlot, nframes = 130)出力例
・geom_treemapコマンド
・geom_treemap_textコマンド
・geom_treemap_subgroup_XXXコマンド
・ggplot2::facet_wrapコマンドを適応
・参考:「gganimateパッケージ」を利用したgifアニメーション
少しでも、あなたの解析が楽になりますように!!

スポンサーリンク