「ggplot2」パッケージで矢印を簡単にプロットすることが可能なパッケージです。実行コマンドでは散布図に対し矢印をプロットしていますが、他の図にも可能なので工夫次第でいろいろな利用ができると思います。
パッケージのバージョンは0.2.0。実行コマンドはwindows 11のR version 4.1.2で確認しています。
パッケージのインストール
下記コマンドを実行してください。
#パッケージのインストール
install.packages("ggarchery")
実行コマンド
詳細はコメント、パッケージのヘルプを確認してください。
#パッケージの読み込み
library("ggarchery")
###データ例の作成#####
#tidyverseパッケージがなければインストール
if(!require("tidyverse", quietly = TRUE)){
install.packages("tidyverse");require("tidyverse")
}
#viridisパッケージがなければインストール
if(!require("viridis", quietly = TRUE)){
install.packages("viridis");require("viridis")
}
set.seed(1234)
n <- 20
PointData <- tibble(Group = rep(paste0("Line", 1:100),
length = n,
each = 2),
X = sample(c(1:10), n, replace = TRUE),
Y = sample(c(25:50), n, replace = TRUE),
Position = rep(c("Start", "End"),
length = n),
Arrow_Fill = rep(viridis_pal()(n),
length = n,
each = 2),
Arrow_Style = rep(c("twodash", "solid"),
length = n,
each = 2))
ArrowData <- PointData %>%
pivot_wider(names_from = Position, values_from = c(X, Y))
########
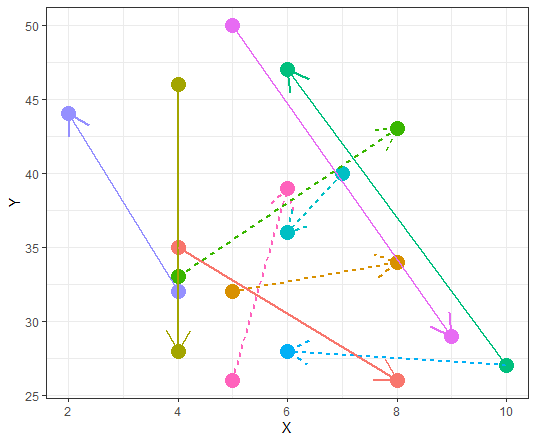
#矢印を描写:geom_arrowsegmentコマンド
ggplot(PointData, aes(x = X, y = Y, col = Arrow_Fill)) +
geom_point(size = 5) +
geom_arrowsegment(data = ArrowData, aes(x = X_Start, xend = X_End,
y = Y_Start, yend = Y_End,
colour = Arrow_Fill,
linetype = Arrow_Style),
size = 1) +
guides(colour = "none", linetype = "none") +
theme_bw()出力例
少しでも、あなたの解析が楽になりますように!!