 RAnalytics
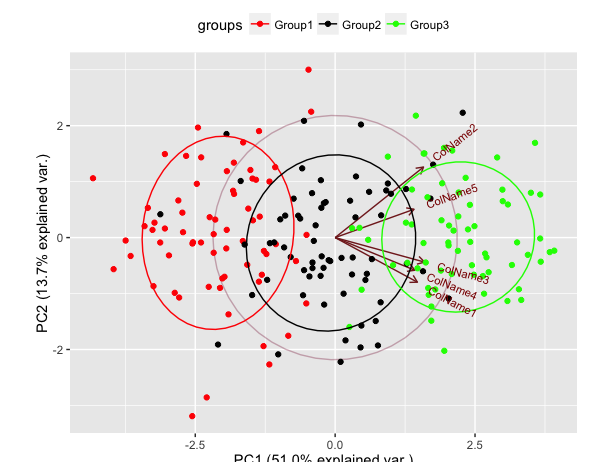
 Analysis in R: PCA results in ggplot2 displayed in Biplot “ggbiplot” package
This is an introduction to the ggplot2 package for displaying the results of a principal component a...
 RAnalytics
  RAnalytics
  RAnalytics
  RAnalytics
 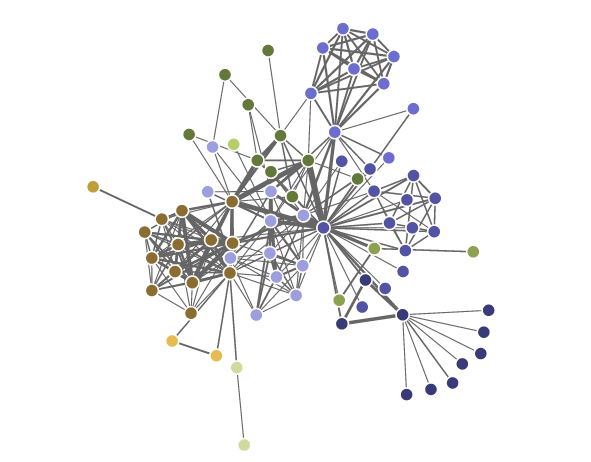 RAnalytics
  RAnalytics
  RAnalytics
  RAnalytics
  RAnalytics
  RAnalytics