 RAnalytics
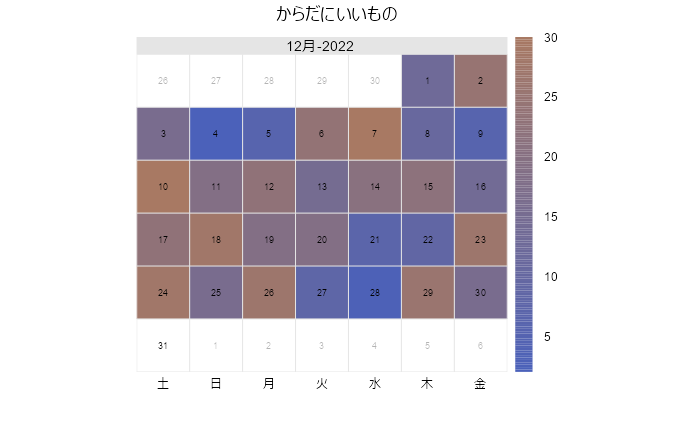
 Analyze in R: Heatmap your calendar! The “openair” package
The "calendarPlot" command included in this package can easily heat map your calendar.It may be inte...
 RAnalytics
  RAnalytics
  RAnalytics
  RAnalytics
 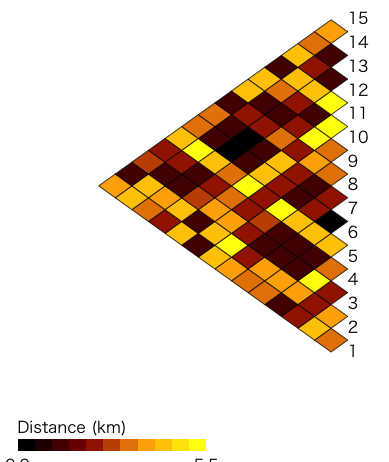 RAnalytics
  RAnalytics
  RAnalytics
  RAnalytics
  RAnalytics
  RAnalytics