スポンサーリンク
RAnalytics

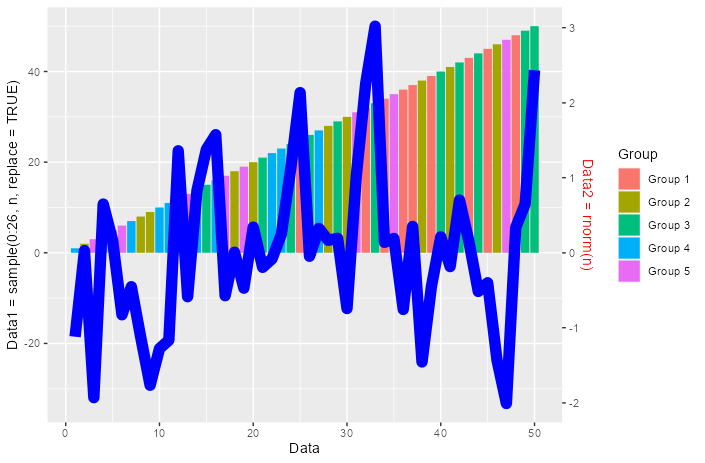
Analysis in R: Creation of 2-axis graphs using only the “ggplot2” package

This is an example of a command to create a 2-axis plot using only the "ggplot2" package. The "scale...
RAnalytics

Analysis in R: “readbulk” package for reading CSV files in bulk

This is an introduction to a package that is useful for reading CSV files from a specified folder at...
RAnalytics

Analysis in R: Any command you can think of that you use every day.

Here are some commands used in R on a daily basis as they come to mind. Checked with R version 4.2.2...
RAnalytics

Analysis in R: Useful for color management “chroma” package

Color schemes are one of the most difficult things to worry about when presentetion. Here is a packa...
RAnalytics

Analysis in R: “exifr” package to obtain EXIF data of photos

This is an introduction to a package for collecting EXIF data for photos. It is useful for photo man...
RAnalytics

Analysis in R: “CatterPlot” package: SCATTER PLOT with cat symbols!

This package is for those who want to create scatter charts with cat symbols. I don't know if it rhy...
RAnalytics

Analysis in R: More than, Less than! Manipulation of data “fancycut” package

This is an introduction to a package that is useful for creating a specified range of data from the ...
RAnalytics

Analysis in R: “foreach” package useful for iterative processing

The "for" and "apply" commands are useful for iterative processing, but they are sometimes inflexibl...
RAnalytics

Analysis in R: Introduction to Distribution Commands

Here are some commonly used distribution commands. To get a random value, add "r" before each comman...
RAnalytics

Analysis in R: Detecting strings as numbers. The “type.convert” command

When manipulating data, the data may change from numbers to letters. A shortcut to the solution is t...
スポンサーリンク