This is an introduction to a package for plotting multivariate characteristics. I find this package very useful for interpreting data. It also includes a “ggmatrix” command that allows you to plot multiple ggplot objects.
Package version is 2.1.2. R version 4.2.2 is confirmed.
Install Package
Run the following command.
#Install Package
install.packages("GGally")
Execute command
See the command and package help for details.
#Loading the library
library("GGally")
###Creating Data Examples#####
n <- 50
TestData <- data.frame(Group = sample(paste0("Group", 1:5),
n, replace = TRUE),
Data1 = rnorm(n),
Data2 = rnorm(n) + rnorm(n) + rnorm(n),
Data3 = sample(0:1, n, replace = TRUE),
Data4 = sample(LETTERS[1:26], n, replace = TRUE))
#######
#Plot data features at once: ggpairs command
#Specify display columns: columns option; default:1:ncol(data)
#Specify color-coded data: mapping option
#Specify upper and lower plot contents: upper,lower option:blank to hide
##Specify content as follows,list(variable type = display contents)
##variable type;display content
##continuous; "points", "smooth", "density", "cor", "blank"
##combo; "box", "dot", "facethist", "facetdensity", "denstrip", "blank"
##discrete; "facetbar", "ratio", "blank" ##na; "na", "blank"
##Specify diagonal plot content: diag option: NULL to hide
##continuous; "densityDiag", "barDiag", "blankDiag"
##discrete; "barDiag", "blankDiag"
##na; "naDiag", "blankDiag"
##maximum number allowed in string/factor string: cardinality_threshold option
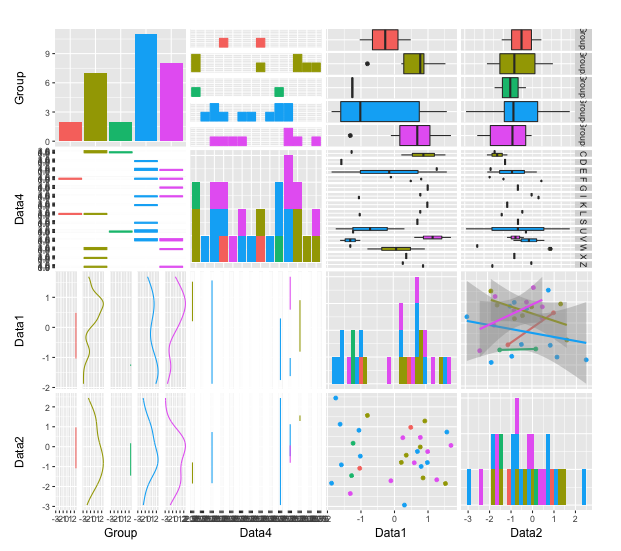
ggpairs(data = TestData, columns = c(1, 5, 2, 3),
mapping = aes(color = Group),
upper = list(continuous = "smooth"),
lower = list(combo = "facetdensity"),
diag = list(continuous = "barDiag"),
cardinality_threshold = 30)
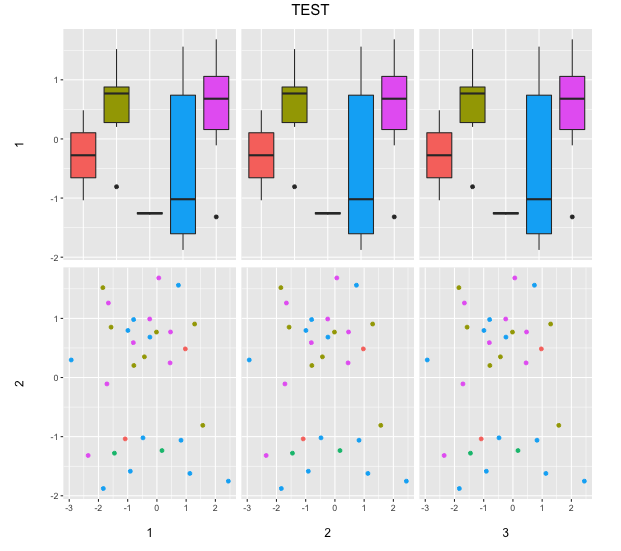
#Plot multiple graphs: ggmatrix command
#Specify number of rows: nrow option
#Specify number of columns: ncol option
#Specify x-axis labels: xAxisLabels option
#Specify y axis labels: yAxisLabels option
#Specify a title: title option
#Descriptive graphs are stored in a list class
PlotList <- list()
list(for (i in 1:3) {
#BoxPlot
PlotList[[i]] <- qplot(data = TestData, x = Group,
y = Data1, fill = Group, geom = "boxplot")
#ScatterPlot
PlotList[[i + 3]] <- qplot(data = TestData, x = Data2,
y = Data1, color = Group, geom = "point") +
ggtitle("TEST")
})
#Plot
ggmatrix(PlotList, nrow = 2, ncol = 3,
xAxisLabels = 1:3, yAxisLabels = 1:2, title = "TEST")Output Examples
・ggpairs command
・ggmatrix command
I hope this makes your analysis a little easier !!