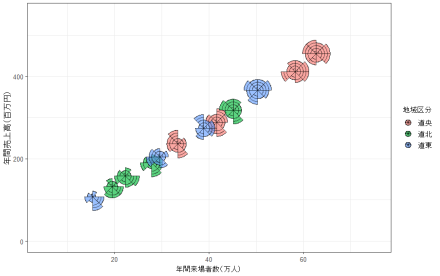
Rで解析:多変量データをグリフで可視化!「ggmultiglyph」パッケージ
散布図に多変量の情報を重ねることで、点の位置だけでは伝えきれない特徴を一枚の図に表現できます。しかし、複数の変数を一つの…
 からだにいいもの
Rのトピックスを中心に『まだ、まだ、知らない、役に立つ情報?』を発信します。
散布図に多変量の情報を重ねることで、点の位置だけでは伝えきれない特徴を一枚の図に表現できます。しかし、複数の変数を一つの…
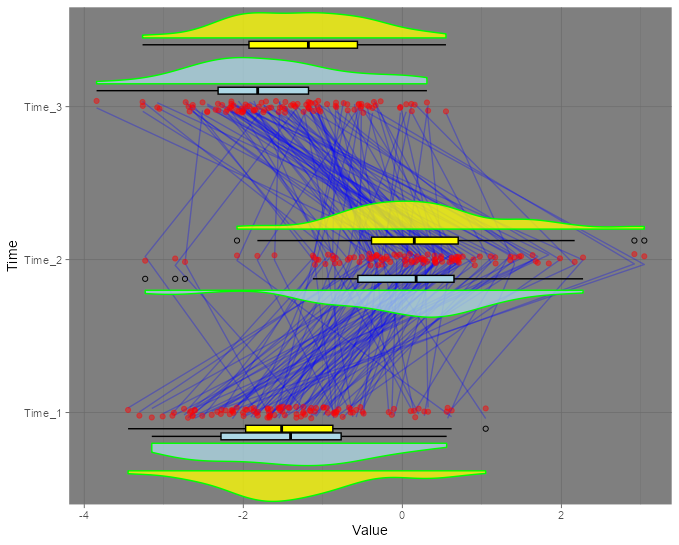
This is an introduction to a package that creates a “R…
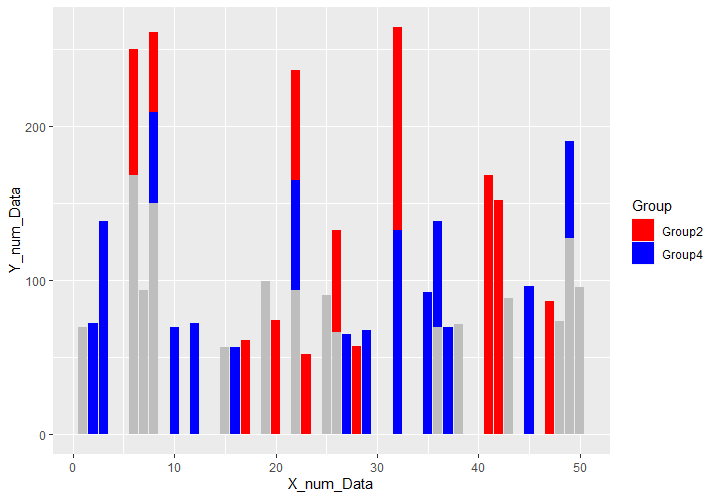
This is an introduction to the “ggplot2” package…
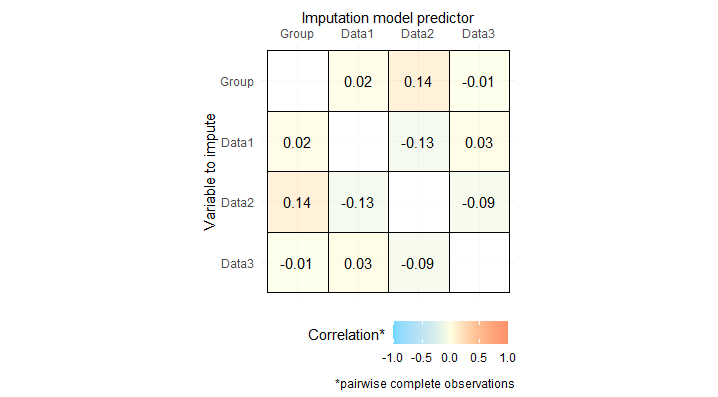
Introducing a package that allows you to create plots that a…
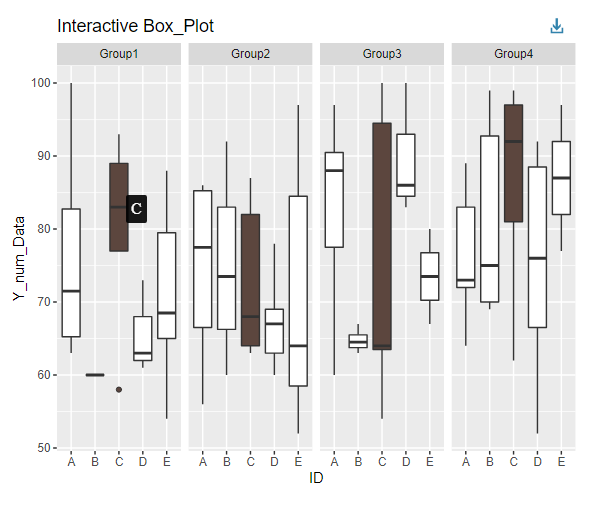
This package makes the graphs in the “ggplot2” p…
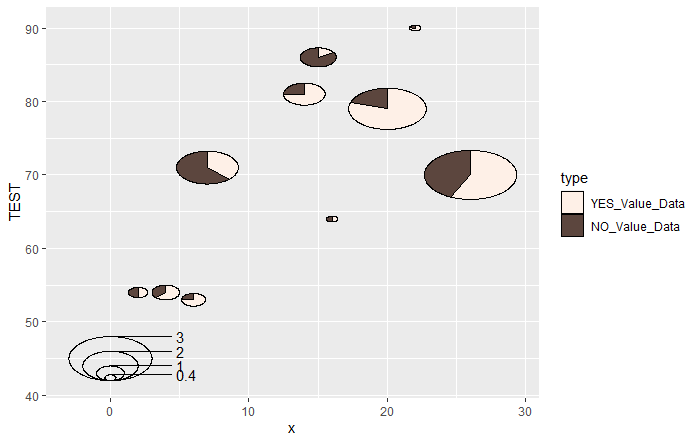
This is an introduction to a package that creates scatter pl…
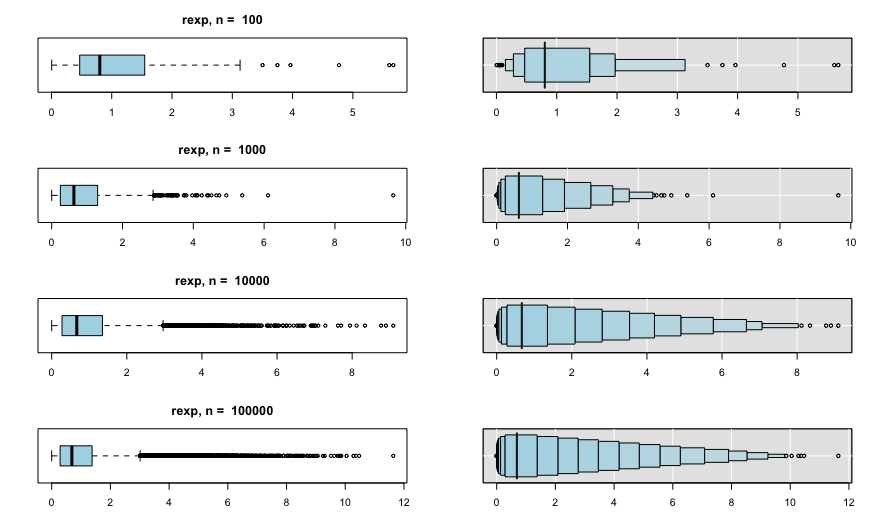
It is a convenient way to express data distribution. You can…
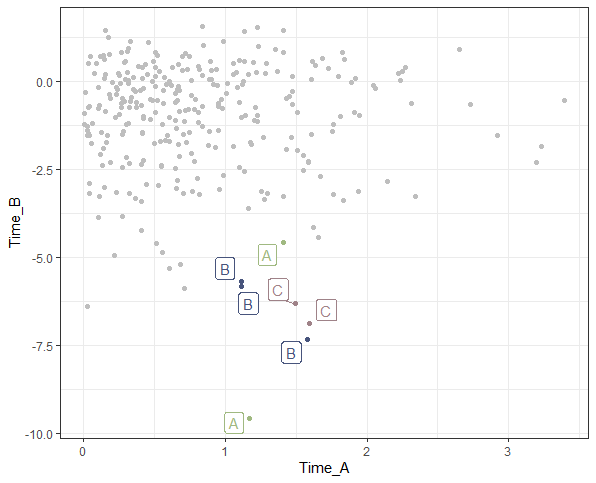
This package is useful for creating graphs that highlight sp…
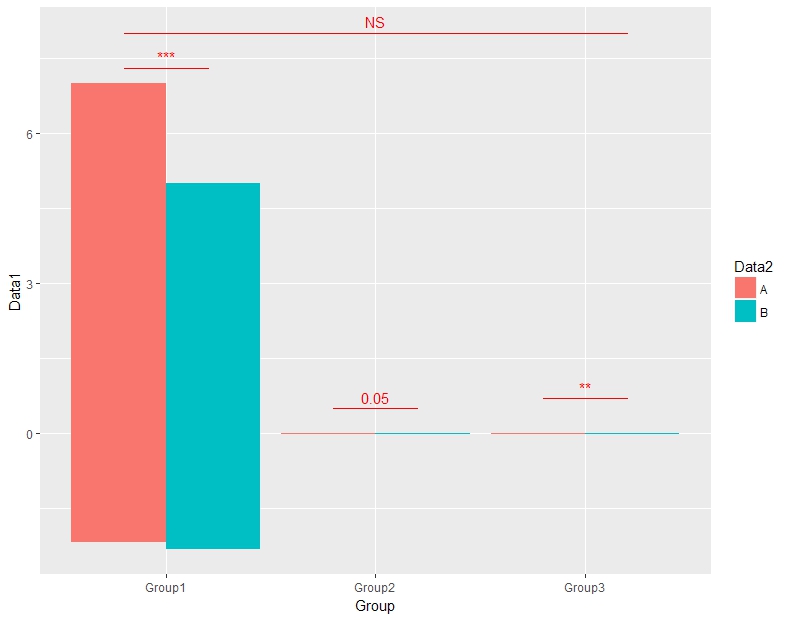
Introduces a package that adds a significant difference symb…
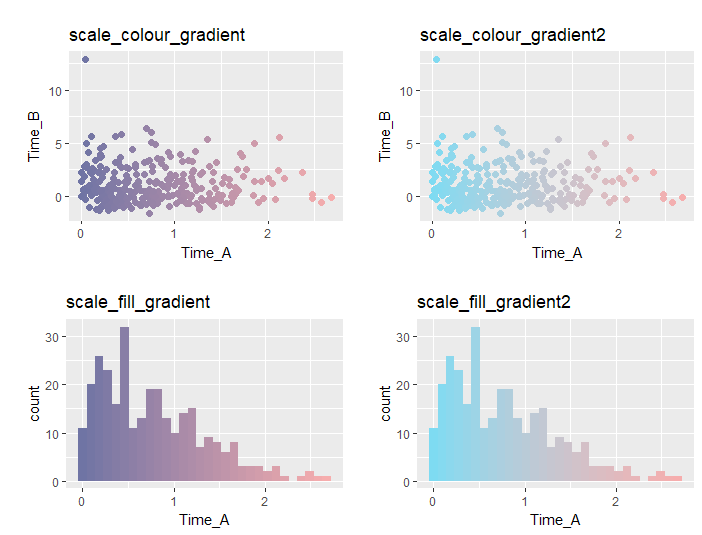
This is a quick summary of how to specify col and fill color…