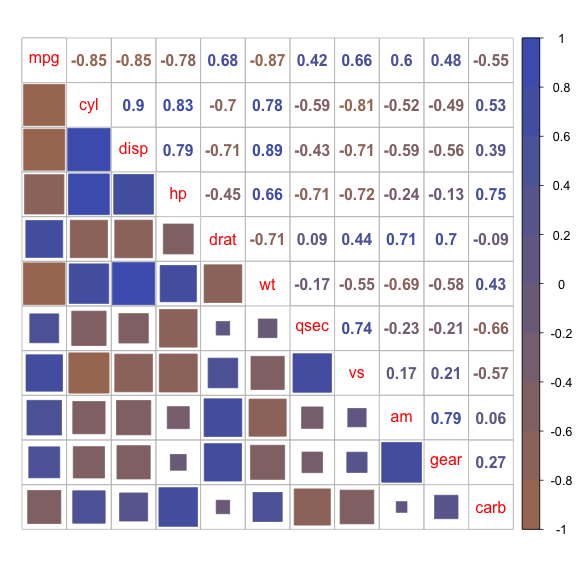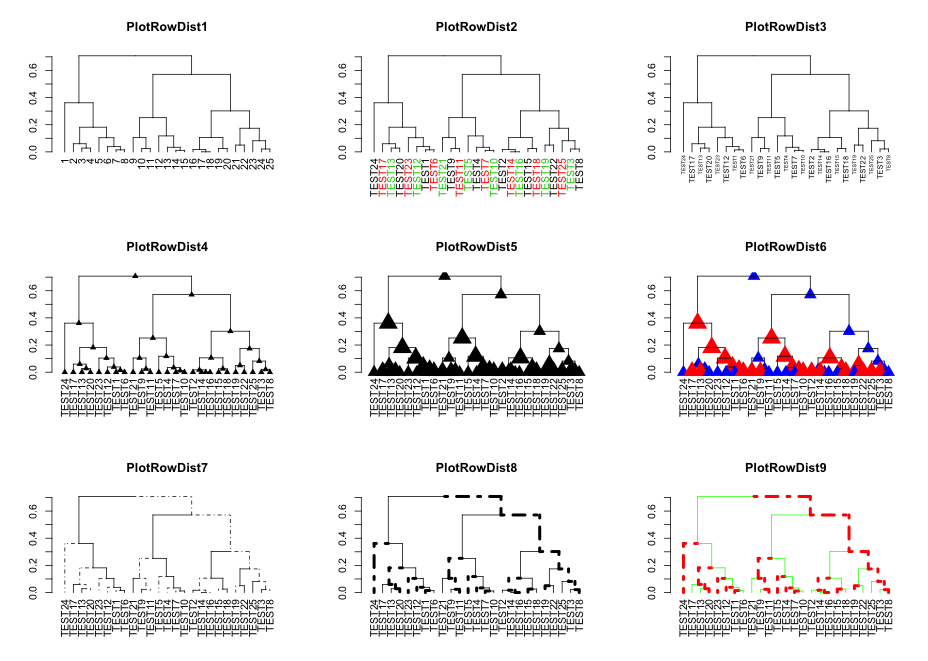
「ggplot2」パッケージを利用して多変数の特徴をプロットすることができるパッケージの紹介です。データの解釈に非常に便利なパッケージかと思います。また、複数のggplotオブジェクトのプロットが可能な「ggmatrix」コマンドも収録されています。
パッケージバージョンは2.1.2。実行コマンドはwindows 11のR version 4.1.2で確認しています。

パッケージのインストール
下記、コマンドを実行してください。
#パッケージのインストール
install.packages("GGally")
実行コマンド
詳細はコメント、パッケージのヘルプを確認してください。
#パッケージの読み込み
library("GGally")

###データ例の作成#####
n <- 50
TestData <- data.frame(Group = sample(paste0("Group", 1:5),
                                      n, replace = TRUE),
                       Data1 = rnorm(n),
                       Data2 = rnorm(n) + rnorm(n) + rnorm(n),
                       Data3 = sample(0:1, n, replace = TRUE),
                       Data4 = sample(LETTERS[1:26], n, replace = TRUE))
#######

#データの特徴を一気にプロット:ggpairsコマンド
#表示列を指定:columnsオプション;初期値:1:ncol(data)
#色分けデータの指定:mappingオプション
#上部,下部のプロット内容を指定:upper,lowerオプション:blankで非表示
##指定内容は以下の通り,list(変数型 = 表示内容)で指定
##変数型;表示内容
##continuous;"points","smooth","density","cor","blank"
##combo;"box","dot","facethist","facetdensity","denstrip","blank"
##discrete;"facetbar","ratio","blank" ##na;"na","blank"
#対角線のプロット内容を指定:diagオプション:NULLで非表示
##continuous;"densityDiag","barDiag","blankDiag"
##discrete;"barDiag","blankDiag"
##na;"naDiag","blankDiag"
#文字列/因子列で許可する最大数:cardinality_thresholdオプション
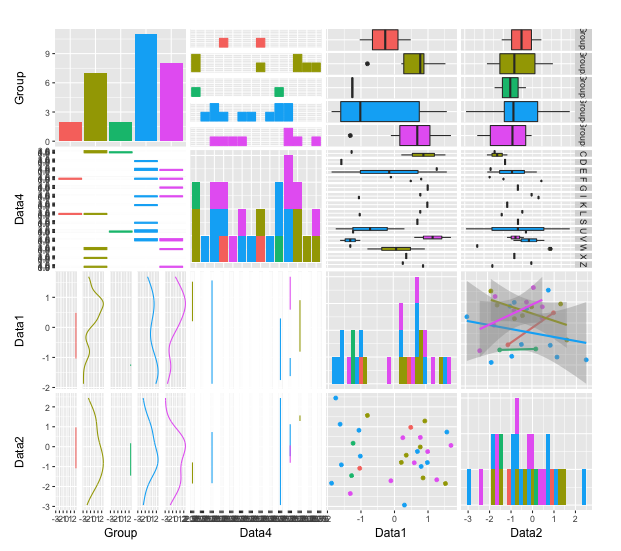
ggpairs(data = TestData, columns = c(1, 5, 2, 3),
        mapping = aes(color = Group),
        upper = list(continuous = "smooth"),
        lower = list(combo = "facetdensity"),
        diag = list(continuous = "barDiag"),
        cardinality_threshold = 30)

#複数のグラフをプロット:ggmatrixコマンド
#行数の指定:nrowオプション
#列数の指定:ncolオプション
#x軸方向ラベルを指定:xAxisLabelsオプション
#y軸方向ラベルを指定:yAxisLabelsオプション
#タイトルを指定:titleオプション
#描写グラフはlist classに格納します
PlotList <- list()
list(for (i in 1:3) {
  #箱ひげ図
  PlotList[[i]] <- qplot(data = TestData, x = Group,
                         y = Data1, fill = Group, geom = "boxplot")
  #散布図
  PlotList[[i + 3]] <- qplot(data = TestData, x = Data2,
                             y = Data1, color = Group, geom = "point") +
                       ggtitle("TEST")
  })

#プロット
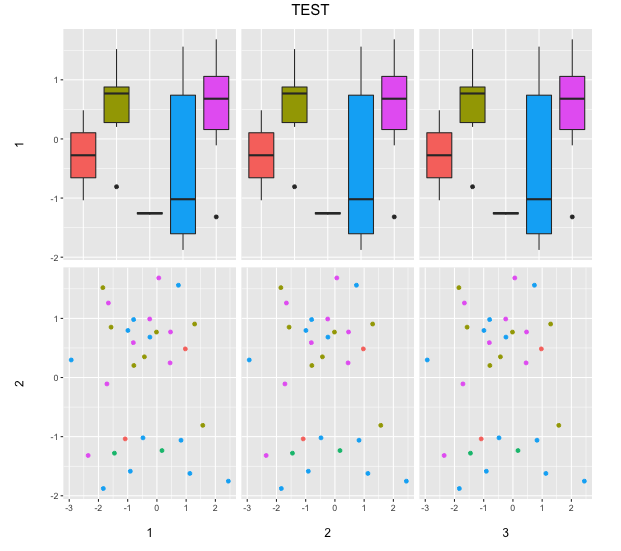
ggmatrix(PlotList, nrow = 2, ncol = 3,
         xAxisLabels = 1:3, yAxisLabels = 1:2, title = "TEST")
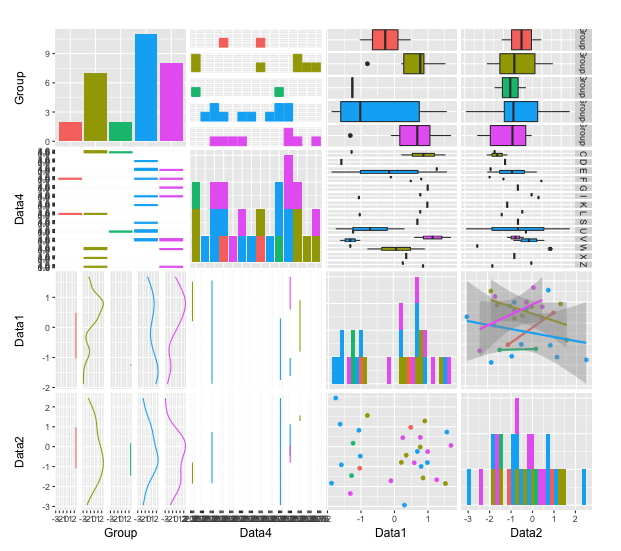
出力結果
・ggpairsコマンド
・ggmatrixコマンド
少しでも、あなたの解析が楽になりますように!!