ggplot2はRの非常に有用なデータの表現パッケージです。そんなggplot2の学習に便利なパッケージの紹介です。ggplotオブジェクトの追加が理解しやすいので何かの参考になるかと思います。
パッケージバージョンは0.2.1。windows 7およびOS X 10.11.5のR version 3.3.1で確認しています。
パッケージのインストール
下記コマンドを実行してください。
#パッケージのインストール
install.packages("ggghost")
実行コマンド
詳細はコマンド、パッケージのヘルプを確認してください。
#パッケージの読込
library("ggghost")
###データ例の作成#####
n <- 50
TestData <- data.frame("Group" = sample(paste0("Group", 1:3), n, replace = TRUE),
"Data1" = sample(rnorm(10), n, replace = TRUE))
########
#ggghostオブジェクトの作成:%g<%コマンド
#ggghostオブジェクトはlist class
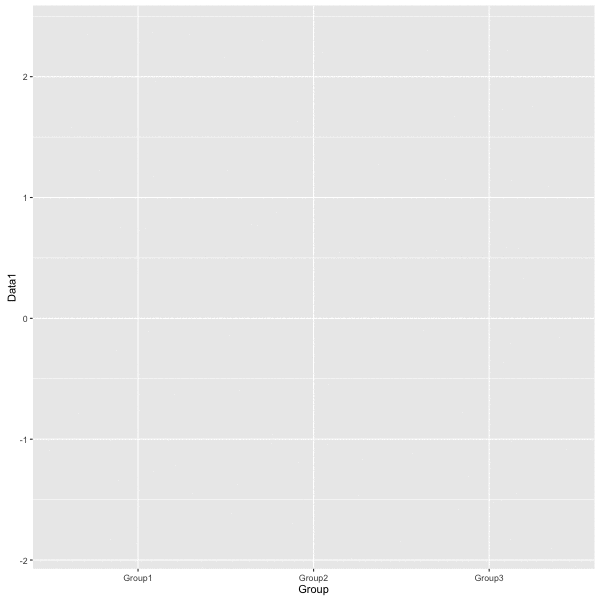
TestPlot %g<% ggplot(TestData, aes(x = Group, y = Data1, fill = Group))
TestPlot <- TestPlot +
geom_boxplot() +
labs(title = "Test ggplot") +
geom_jitter(col = "red")
#プロット
TestPlot
#ggghostオブジェクトの内容確認
#コマンドで表示するにはcombine = TRUEを追加
summary(TestPlot)
[[1]]
ggplot(TestData, aes(x = Group, y = Data1, fill = Group))
[[2]]
geom_boxplot()
[[3]]
labs(title = "Test ggplot")
[[4]]
geom_jitter(col = "red")
#ggplotオブジェクトを削除:-コマンド
#geom_jitterを削除
TestPlot - geom_jitter()
#titleを削除
TestPlot - labs(title)
#プロット内容をGifアニメで出力:reanimateコマンド
reanimate(TestPlot, "TestPlot.gif")出力例
・reanimateコマンド
少しでも、あなたのウェブや実験の解析が楽になりますように!!