円グラフの散布図を作成するパッケージの紹介です。非常に面白い表現だと思います。
パッケージバージョンは0.1.7。実行コマンドはR version 4.2.2で確認しています。
パッケージのインストール
下記コマンドを実行してください。
#パッケージのインストール
install.packages("scatterpie")
実行コマンド
詳細はコマンド、パッケージのヘルプを確認してください。
###データ例の作成#####
#tidyverseパッケージがなければインストール
if(!require("tidyverse", quietly = TRUE)){
install.packages("tidyverse");require("tidyverse")
}
set.seed(1234)
n <- 10
TestData <- tibble(Group = sample(paste0("Group", 1:4), n,
replace = TRUE),
#x軸の座標
X_Point_Data = sample(c(1:30),
n, replace = TRUE),
#y軸の座標
Y_Point_Data = sample(c(51:100), n, replace = TRUE),
#円グラフデータ_1
YES_Value_Data = sample(c(1:5), n, replace = TRUE),
#円グラフデータ_2
NO_Value_Data = sample(c(1:5), n, replace = TRUE),
#円の大きさ
Radius = sample(c(5:100), n, replace = TRUE)/30)
########
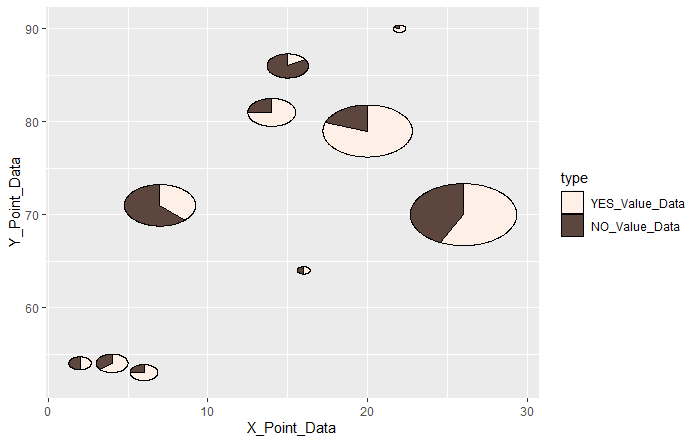
#散布図のシンボルを円グラフで描写:geom_scatterpieコマンド
#円グラフの大きさを指定:aes(r = "数値")で設定
#データを指定:colsオプション;列名で指定
#グラフ塗色の変更はscale_fill_manualコマンドを利用
ggplot() +
geom_scatterpie(data = TestData,
aes(x = X_Point_Data, y = Y_Point_Data, r = Radius),
cols = c("YES_Value_Data", "NO_Value_Data"),
alpha = 1.0) +
scale_fill_manual(values = c("#fef0e7", "#5c463e"))
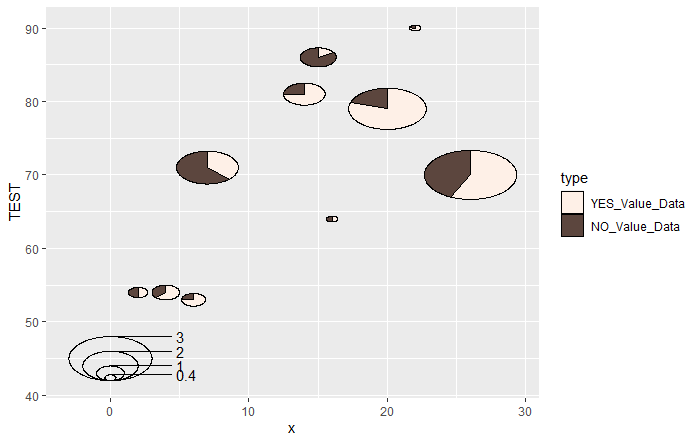
#グラフに凡例を追加:geom_scatterpie_legendコマンド
#円グラフの凡例大きさを指定:radiusオプション
#分割数を指定:nオプション
#y軸ラベルが[ラベル名 + r]となる,labsコマンドで修正可能
ggplot() +
geom_scatterpie(data = TestData,
aes(x = X_Point_Data, y = Y_Point_Data, r = Radius),
cols = c("YES_Value_Data", "NO_Value_Data"),
alpha = 1.0) +
scale_fill_manual(values = c("#fef0e7", "#5c463e")) +
#geom_scatterpie_legendコマンド
geom_scatterpie_legend(radius = TestData$Radius, x = 0, y = 45, n = 5) +
#y軸ラベルを調整
labs(y = "TEST")出力例
・geom_scatterpieコマンド
・geom_scatterpie_legendコマンド
少しでも、あなたの解析が楽になりますように!!