Rで解析:継続的なデータ表現に便利です「waterfalls」パッケージ
継続的なデータを表現するのに便利なwaterfall plotを簡単に作成できるパッケージです。データの最後尾に合計をプロットも可能です。なお、「waterfalls」パッケージは「ggplot2」パッケージのコマンドが適応可能です。
パッケージバージョンは0.1.2。実行コマンドはwindows 11のR version 4.1.3で確認しています。
パッケージのインストール
下記コマンドを実行してください。
#パッケージのインストール
install.packages("waterfalls")
スポンサーリンク
実行コマンド
詳細はコマンド、パッケージのヘルプを確認してください。なお、「fill_by_sign = TRUE」時の塗色を変更するときは下記リンクの回答を参考にしてはいかがでしょうか。
・Chnaging ggplot colors and increasing the size of the text (inside the plot area)
#パッケージの読み込み
library("waterfalls")
###データ例の作成#####
set.seed(1234)
n <- 10
TestData <- data.frame(Group = paste0("Group", 1:n),
Data1 = round(rnorm(n), 1))
########
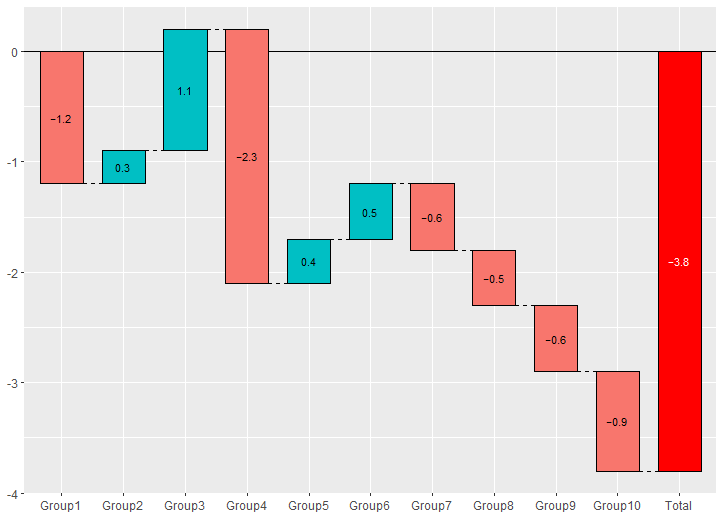
#waterfallプロットの作成:waterfallコマンド
waterfall(values = TestData$Data1,
labels = TestData$Group,
#バー表示テキストサイズ
rect_text_size = 1,
#バー表示テキスト位置
rect_text_labels_anchor = "centre",
#バー塗色;指定する場合は「fill_by_sign = FALSE」
#fill_colours = colorRampPalette(c("red",
# "#d5e6f2"))(nrow(TestData)),
#バー塗色をプラス/マイナスで分ける
fill_by_sign = TRUE,
#バー枠線
rect_border = "black",
#バー幅
rect_width = 0.7,
#合計バーを右端に表示:TRUE/FALSE
calc_total = TRUE,
#合計バーの表示内容
total_rect_text = sum(TestData$Data1),
#合計バー塗色
total_rect_color = "red",
#合計バー表示テキスト色
total_rect_text_color = "white",
#バー間の移動線表示
draw_lines = TRUE,
#バー間の移動線表示位置
lines_anchors = c("right", "left"),
#バー間の移動線種
linetype = "dashed",
#0基準線の表示内容:"none","behind","front"
draw_axis.x = "behind",
#Y軸スケールの自動調整
scale_y_to_waterfall = TRUE,
#ggplotオブジェクトで保存
print_plot = TRUE,
#ggplotオブジェクト名の指定
ggplot_object_name = "TestWater")
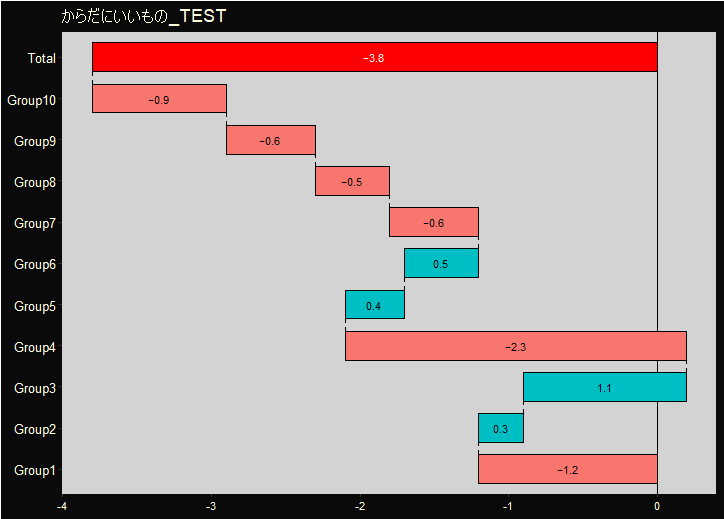
###試しに出力したggplotオブジェクト「TestWater」を
###ggplot2パッケージで編集
#ggplot2を含むtidyverseパッケージの読み込み
#tidyverseパッケージがなければインストール
if(!require("tidyverse", quietly = TRUE)){
install.packages("tidyverse");require("tidyverse")
}
#編集
TestWater +
#X軸Y軸を入れ替え
coord_flip() +
#グラフタイトルを追加
labs(title = "からだにいいもの_TEST") +
#テーマを設定
theme(title = element_text(colour = "#ffffe0"),
axis.title = element_blank(),
axis.text = element_text(colour = "#ffffe0"),
axis.text.x = element_text(size = 8),
axis.text.y = element_text(size = 10),
panel.grid = element_blank(),
panel.background = element_rect(fill = "lightgray"),
plot.background = element_rect(fill = "#0a0a0a"))
########出力例
・waterfallコマンド
・ggplotオブジェクト「TestWater」をggplot2パッケージで編集
少しでも、あなたの解析が楽になりますように!!
スポンサーリンク